
Updated: April 7, 2023.
A full Core Web Vitals audit checklist with explanations, examples, possible fixes, screenshots, and more.
Here I am sharing with you a 35-step Core Web Vitals audit checklist that you can use to audit a website in terms of Google speed and performance metrics known as Web Vitals.
- The Core Web Vitals checklist is divided into three sections, each focusing on one of the three Core Web Vitals metrics.
- Each step describes the impact a given element can have on LCP, FID, or CLS, explains why this is important, provides an example, and suggests possible fixes.
- At the end of the list, there will be a downloadable template you can use to perform the Core Web Vitals audit of any website.
That’s all you need to make either your or your client’s site ready for the Core Web Vitals update.
I dug through the Google documentation on Core Web Vitals and how to improve each metric. I did my best to pull all the best practices, tips, and possible fixes from there and put them in one place in the form of a relatively easy-to-digest guide. I hope I have just saved you at least 7 days of in-depth reading!

❗ Check my Core Web Vitals guide to learn more about the metrics, what they are, or how they work.
Tools To Audit Core Web Vitals
Of course, you want to start your Core Web Vitals audit by actually measuring the Core Web Vitals metrics for the site you are auditing.
Here are the tools you will need to do a Core Web Vitals audit. The more tools you use, the more in-depth your analysis will be.
The field tools to audit Core Web Vitals:
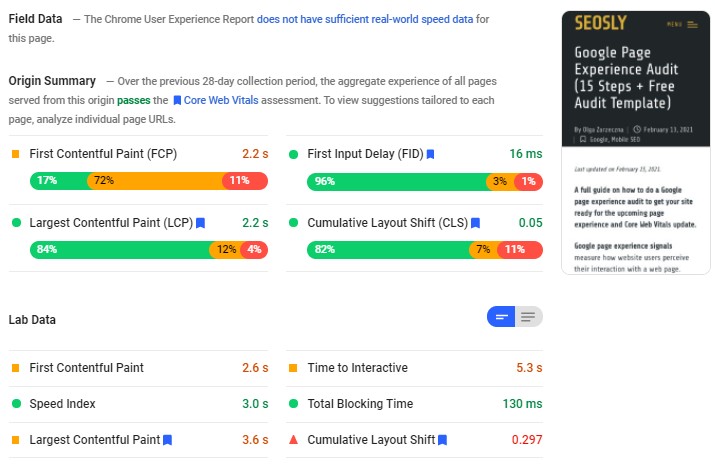
- Google PageSpeed Insights (an essential tool to analyze Core Web Vitals on a per-page basis)
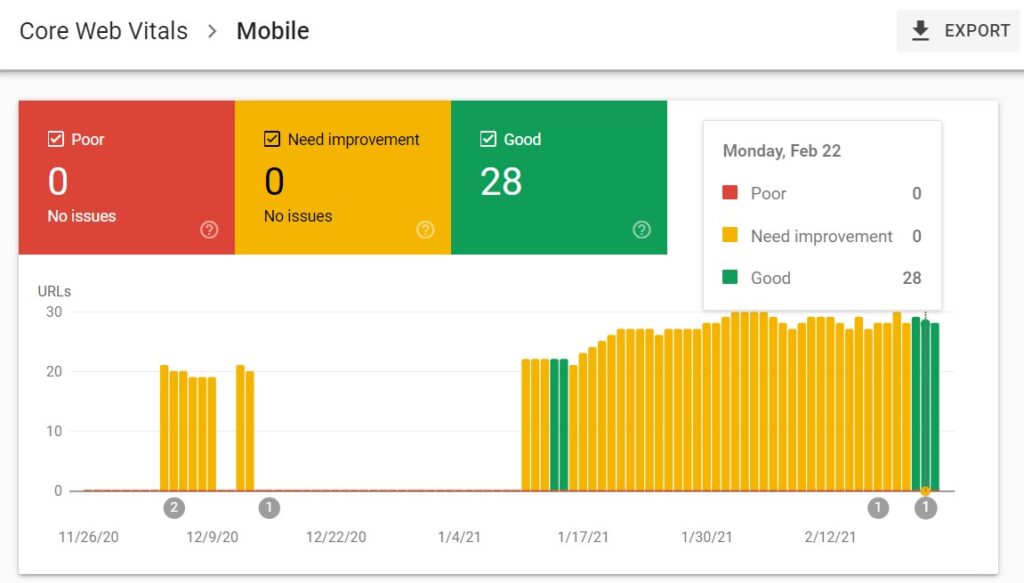
- Google Search Console (Core Web Vitals report) (an essential tool to analyze Core Web Vitals in bulk)
- Chrome User Experience Report (the data from the CrUX report are used by both Google PageSpeed Insights and the Core Web Vitals report in GSC)
- web-vitals JavaScript library (if you are a developer and want to measure Core Web Vitals in JavaScript)
Field tools provide real-world data on how actual users are experiencing the website. Field data are more accurate than lab data which are usually only estimates.
The lab tools to audit Core Web Vitals:
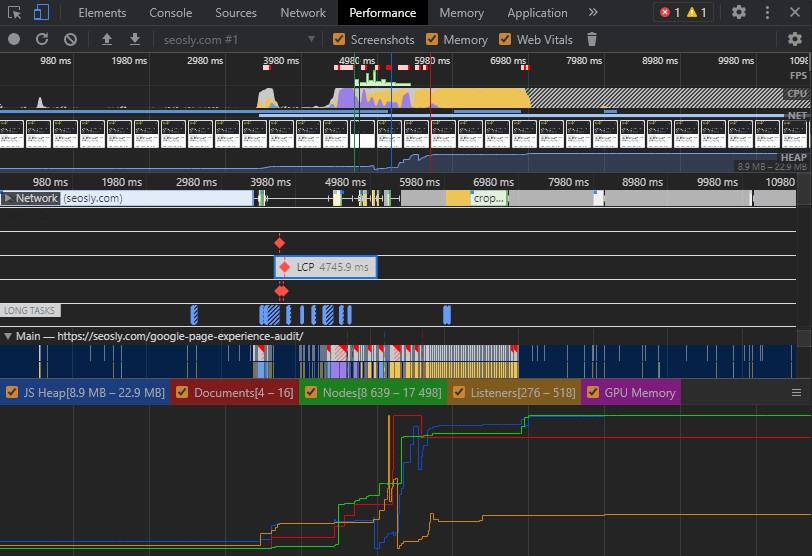
- Chrome DevTools (a more advanced tool that lets you thoroughly analyze how your site is loading)
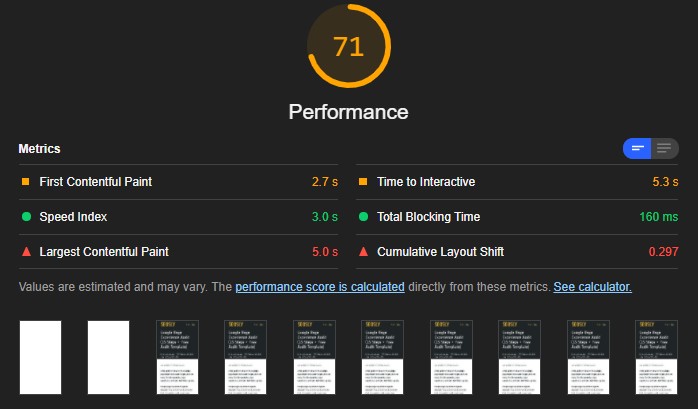
- Lighthouse (ideal for making tests and testing improvements in the lab environment)
- WebPageTest (great if you want to dig really deep)
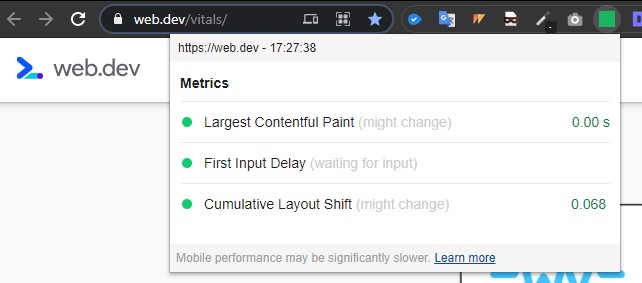
- Web Vitals Chrome extension (it measures Core Web Vitals in real-time on desktop)
Lab tools provide lab data that you can use to test different implementations to check if a given fix works and can actually improve a specific metric. Lab data give you an idea of how a site is doing but do not give you the whole picture.
I will tell you exactly which tools to use to measure each of the three Core Web Vitals metrics in just a moment.
⚡ Make sure to check my full list of tools to measure Core Web Vitals.
Core Web Vitals Audit Checklist
This Core Web Vitals checklist contains all the possible things you should check when auditing the site in terms of Core Web Vitals, Google page experience signals, and overall performance and speed.
Note that the implementation of these fixes in many cases requires programming knowledge. You – as an SEO – can treat this checklist as a set of guidelines for developers who will most likely be implementing those fixes under your guidance.
Let’s get into it!
❗ Note that many if not most of the issues I am describing here can be solved with the use of WP Rocket (an optimization plugin for WordPress). Check my review of WP Rocket to learn more.
⚡ Core Web Vitals are just one of many on-page SEO factors. Make sure to check my on-page SEO checklist with 70+ on-page SEO elements and 500+ pro SEO tips. And my website redesign SEO checklist.
Largest Contentful Paint (LCP)
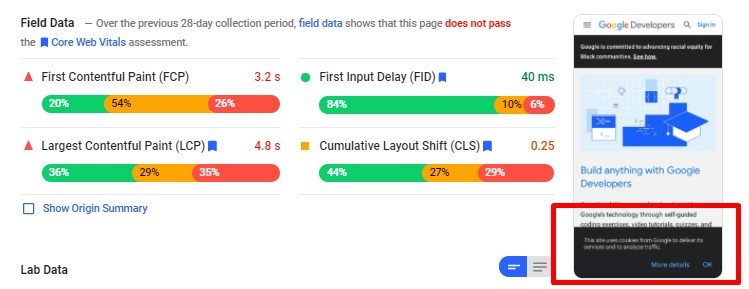
Largest Contentful Paint (LCP) measures the loading performance of a web page. A website will provide a good user experience if its LCP metric is below or equal to 2.5 s.
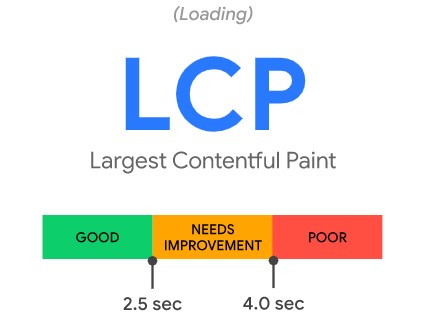
In simple terms, LCP measures the perceived load time by calculating how quickly the main content of the web page loads. A text block or an image is usually considered the main content.
The field tools to measure LCP:
- Google PageSpeed Insights (the tool you should use each time you audit Core Web Vitals on a per-page basis)
- Google Search Console (Core Web Vitals report) (the essential tool to audit Core Web Vitals across the entire website)
- Chrome User Experience Report (the data from the CrUX report is used by Google PageSpeed Insights and Google Search Console)
- web-vitals JavaScript library (if you are a developer)
The lab tools to measure LCP:
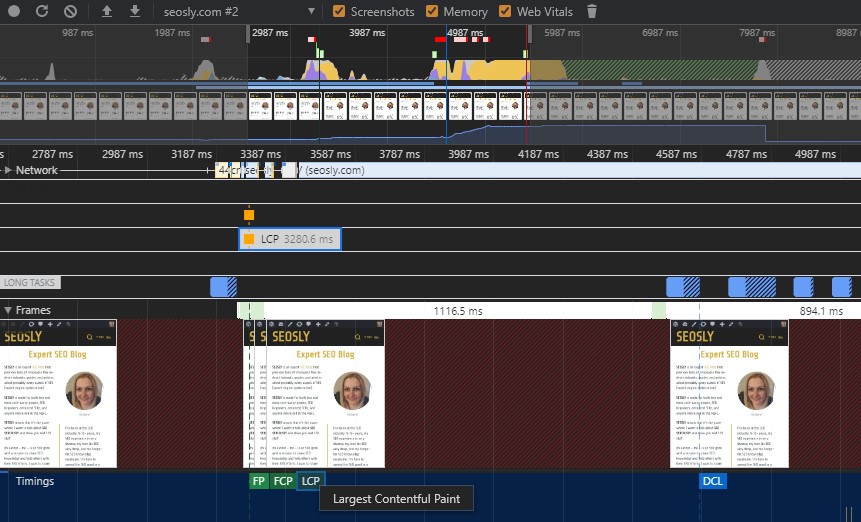
- Chrome DevTools (will show you the LCP of the site tested)
- Lighthouse (this tool works similar to PSI because PSI takes lab data from Lighthouse)
- WebPageTest (an ideal tool for advanced users who want to dig deep into how a site loads)
- Web Vitals Chrome extension (a great tool for testing Core Web Vitals for desktop and in a lab environment)
For the purposes of this audit, I recommend you use Google PageSpeed Insights and the GSC Core Web Vitals report to examine field data regarding LCP.
In addition, make sure to use Chrome DevTools, Lighthouse, and WebPageTest to check what is considered to be the LCP of the web page tested.
⚡ Check my guide to Largest Contentful Paint.
Check if the server is optimized properly.
An unoptimized and overloaded server can increase the amount of time the browser needs to download the website data.
Any expensive queries taking a lot of time to complete or other types of complex operations that are happening on the side of the server will negatively influence server response times and page-load metrics.
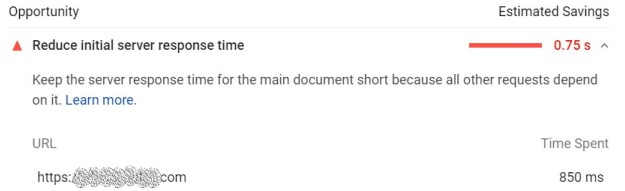
Slow server response times almost always lead to a poor LCP score.
Here is what you can do and the fixes you can recommend:
- Test the website with the Google PageSpeed Insights tool. The tool will indicate if there are slow server response issues on the site. If the tool indicates this issue, make sure to investigate it further.
- Many hosting providers let you implement some basic server optimizations. I recommend you check what the hosting provider of the site offers.
- One of the server optimizations you can do is, for example, to update PHP to the latest version.
- Google has a nice guide on how to optimize an overloaded server. Check this out if you want to dig deeper into the subject.
2. Check if a Content Delivery Network (CDN) is used.
A Content Delivery Network (CDN) is a geographically distributed network of servers working together to provide fast delivery of website resources.
A website that uses a CDN will load faster because its users will not have to wait for network requests to servers located far away. Servers located in the neighborhood will be used instead.
Here is what to do or recommend:
- Check if the website uses a CDN. You can use the CDN Finder tool to quickly check that.
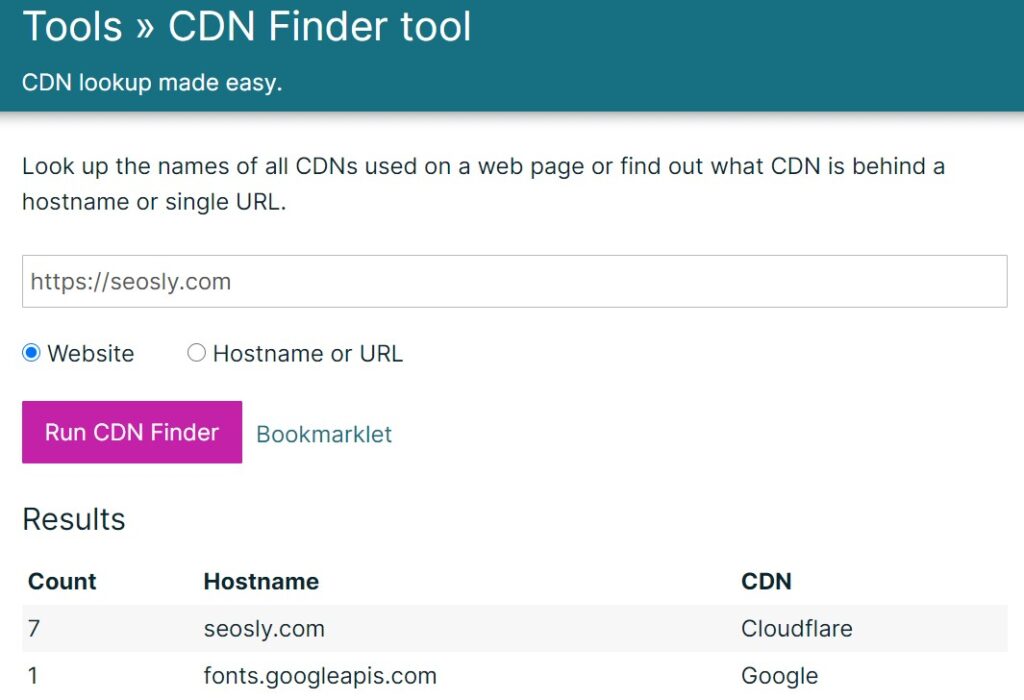
- If the site does not use a CDN, recommend that it gets one. There are a lot of CDNs out there. The most popular one is Cloudflare which is free.
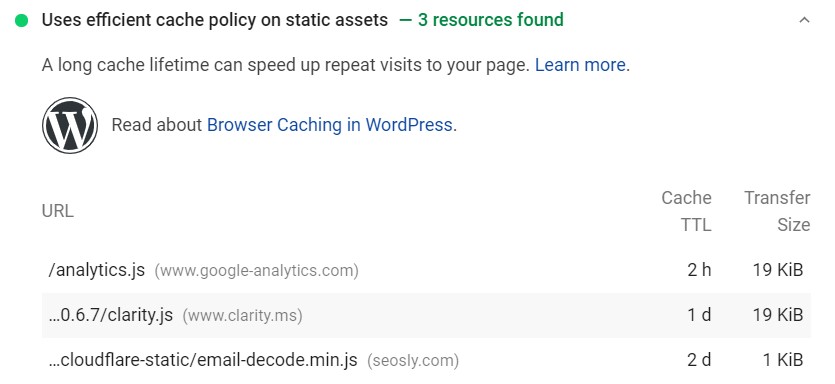
3. Check if website assets are cached.
Caching website assets is one of the most important speed and performance improvements that directly impact the Largest Contentful Paint metric.
If the HTML code of the website is static (and there is no need to change it on every request), then – thanks to caching – there is no need to recreate it unnecessarily. This can significantly reduce the TTFB metric and minimize resource usage.
Here is what to do:
- Use the Google PageSpeed Insights tool to check if website assets are cached.
- The tool will indicate the list of resources that are not cached or do not use an efficient cache policy.
- Recommend applying server caching. There are many different ways to do that:
- Configure reverse proxies, such as Varnish or Nginx so that they act like a cache server or serve cached content.
- Configure your cloud provider, such as Azure or AWS to cache assets.
- Use a CDN (see the point above).
4. Check if full or partial HTML pages cache-first are served.
Serving HTML pages cache-first allows for caching either some or all of the HTML content of a web page and updating the cache only if the content changes.
This can be done with the use of a service worker that will be running in the background and intercepting any server requests. Using a service worker can significantly improve the Largest Contentful Paint metric.
Here is what to do and recommend:
- You can use the Service Worker Detector Chrome plugin to check if a website uses a service worker.
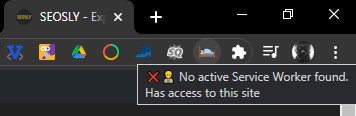
- If the site does not use a service worker, recommend using one.
- The developer should know how to implement a service worker to achieve smaller HTML payloads.
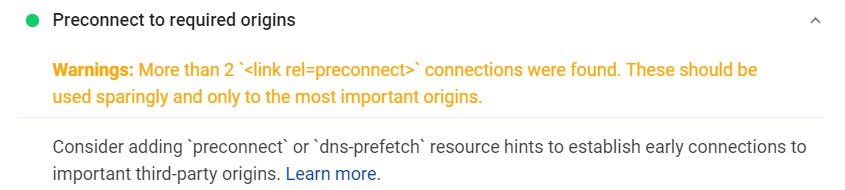
5. Check if third-party connections are established early.
LCP can be significantly reduced if third-party connections are established as early as possible.
Establishing third-party connections is especially important if server requests to third-party origins are necessary to display the critical content of the web page. A website can use either rel="preconnect" or rel="dns-prefetch" to do that.
Here is what to do or recommend:
- Test the website with the use of the Google PageSpeed Insights tool to check if third-party connections are established early.
- If the site uses
rel="preconnect", then the tool will mark that as a passed audit. If not, then the tool will mark this as an opportunity.
- You can recommend one of the following solutions:
- Use
rel="preconnect" - Use
rel="dns-prefetch" - Or use
rel="dns-prefetch"as a fallback for browsers not supportingrel="preconnect"(recommended the most)
- Use
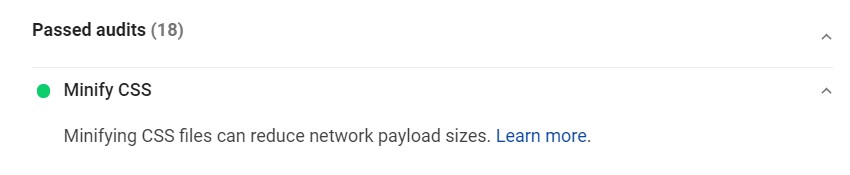
6. Check if CSS is minified.
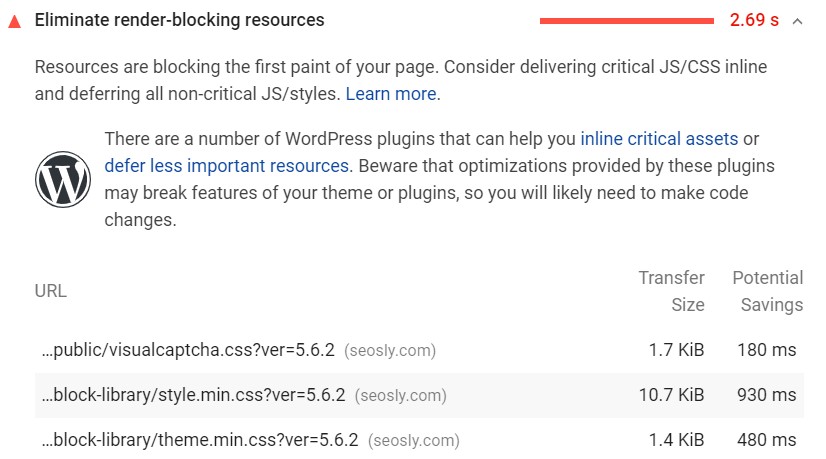
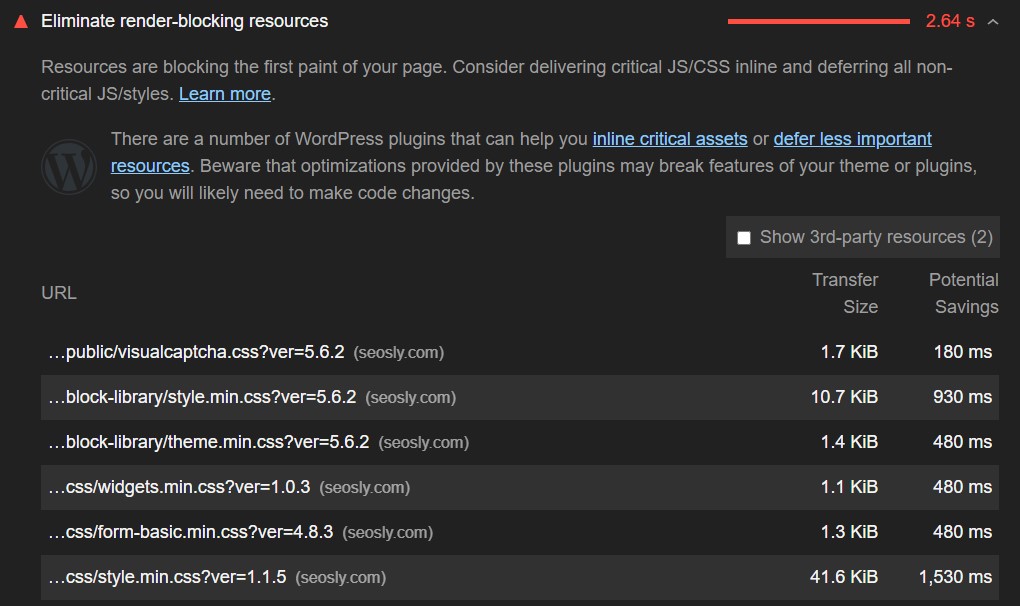
Stylesheets and scripts are render-blocking resources that negatively impact both First Input Delay (FID) and Largest Contentful Paint (LCP).
The site should have the minimal amount of necessary render-blocking CSS. Minification is one of the ways to reduce the amount of blocking CSS.
Here is what you need to do:
- Test the site with Google PageSpeed Insights to see if CSS is minified.
- The tool will indicate whether or not CSS is minified.
- If CSS is not minified, recommend its minification. Depending on how the site is built and what technology it uses, there are many ways to minify CSS.
- For websites using a module bundler or build tool, you should recommend including a special plugin to minify CSS files.
- optimize-css-assets-webpack-plugin (for webpack)
- gulp-clean-css (for Gulp)
- rollup-plugin-css-porter (for Rollup)
❗ In the case of WordPress websites, you can use a plugin that will do all or most of the job for you. I recommend WP Rocket (check my review of WP Rocket to learn more).
7. Check if non-critical CSS is deferred.
Non-critical CSS should be deferred because it can have a huge impact on the Largest Contentful Paint metric and is a render-blocking resource.
Another way to optimize CSS delivery is by deferring non-critical CSS, which minimizes CSS blocking time.
Here is what you can do:
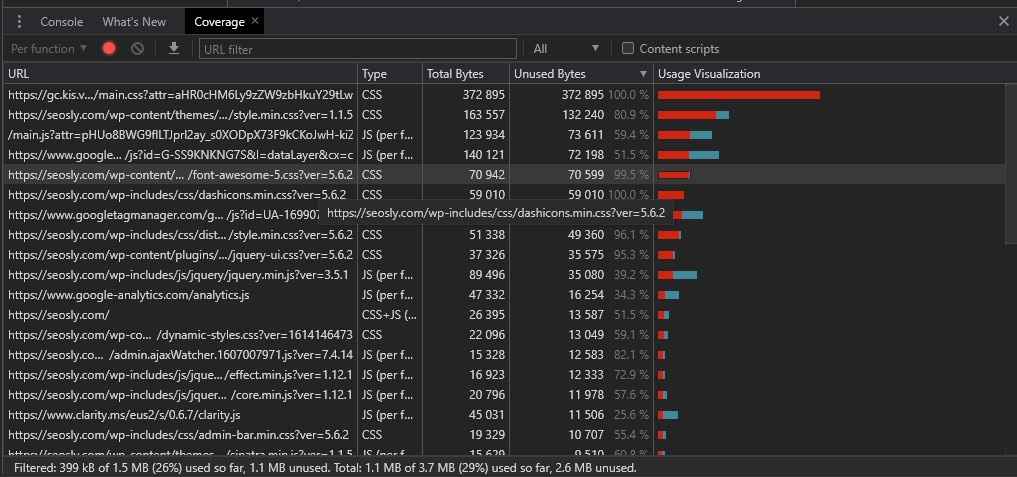
- You can find any unused CSS on the web page by using the Coverage tab in Chrome DevTools.
- The Google PageSpeed Insights tool will also detect non-critical CSS that could be deferred.
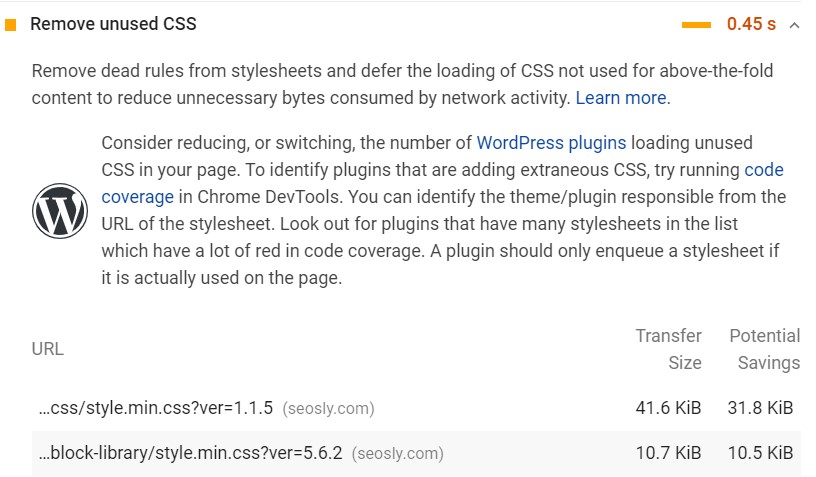
- Recommend that any unused CSS be either entirely removed or moved to another stylesheet if it is used on a different web page.
- In the case of CSS not required for initial rendering, recommend loading files asynchronously with the use of loadCSS.
<link rel="preload" href="stylesheet.css" as="style" onload="this.rel='stylesheet'">
8. Check if critical CSS is inlined.
By inlining important styles, you will make it much quicker for the browser to fetch critical CSS, which will improve the LCP of the page.
Any critical CSS that is used in the above-the-fold section of the website should be inlined directly in <head>.
Here is what to do and recommend:
- Test the website with Google PageSpeed Insights to check if critical CSS is inlined.
- If critical CSS is not inlined, recommend one of the following:
- Manually adding inline styles to the site.
- Using a library to automate the process. Examples of libraries include Critical, CriticalCSS, and Penthouse. There is also a webpack plugin Critters.
- In the case of WordPress websites, you can use one of many optimization plugins. I recommend WP Rocket.
9. Check if JavaScript files are minified and compressed.
By reducing the amount of blocking JavaScript you can significantly reduce the LCP score of the website.
The site should serve only the minimal amount of necessary JavaScript to users. The purpose of the JavaScript minification is to create a lighter but still valid JS file by removing any whitespace or unnecessary code.
Here are the steps to follow:
- The Google PageSpeed Insights tool will show you if JavaScript files are minified on the web page.
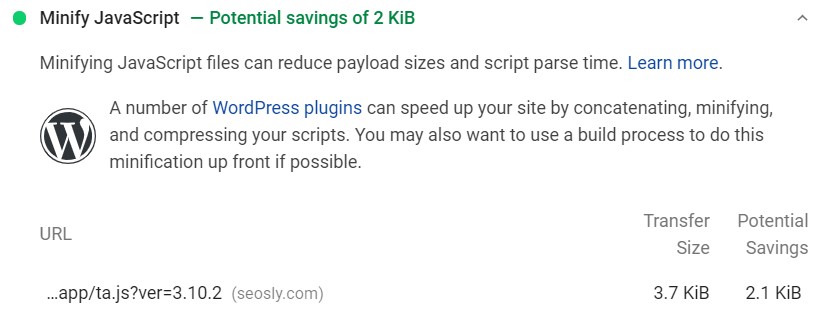
- If JS is not minified, then the audit should recommend JS minification. The fixes you can recommend include:
❗ WP Rocket is a brilliant WordPress plugin that can do that automatically.
10. Check if unused JavaScript is deferred.
The less JavaScript code is on the web page, the less time the browser needs to execute JS, and the quicker it can respond to any user interactions.
JavaScript is always render-blocking. By reducing the amount of unused JavaScript, you can improve both the LCP and FID metrics. The best practice is to load only the code that is necessary for the web page or in response to user input.
Here is what you can do:
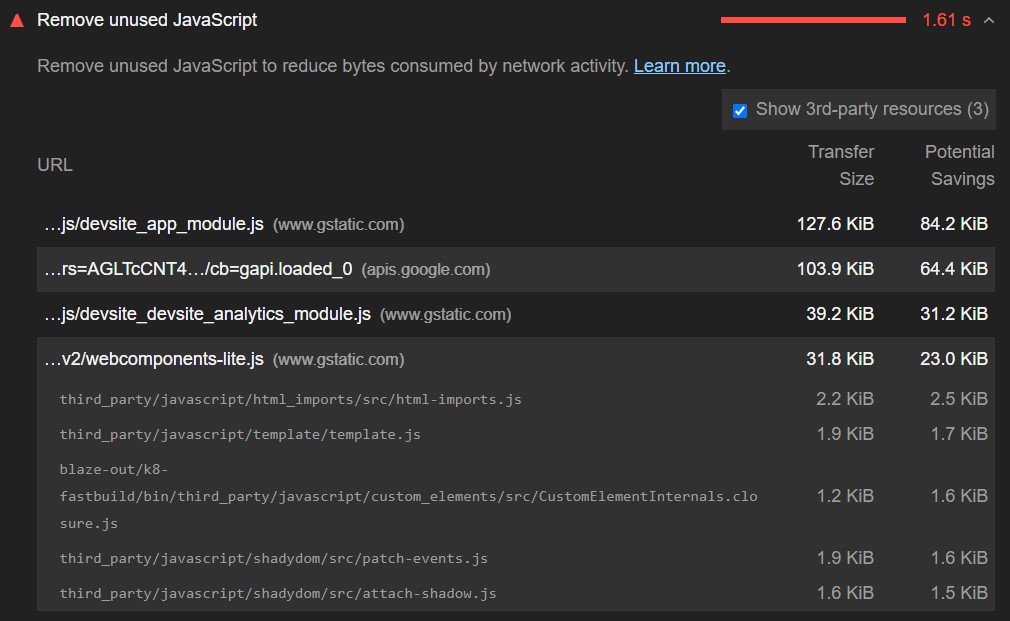
- Test the webpage using the Google PageSpeed Insights tool to check if it detects any unused JavaScript.
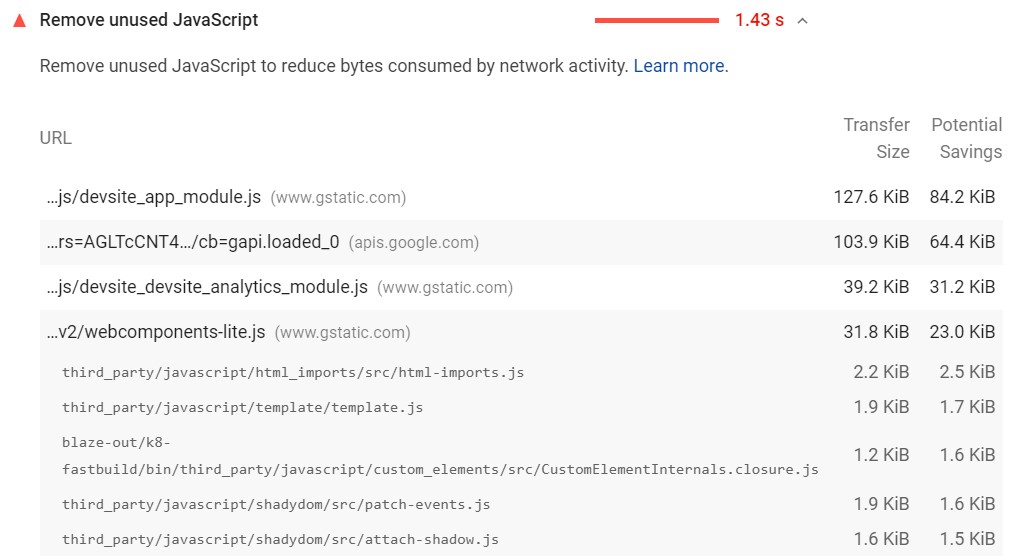
- You can also use Chrome DevTools (the Coverage tab as shown above) to check how much unused JavaScript the web page has.
- One of the best ways to fix this issue is to simply defer non-critical JavaScript and third-party scripts with the use of
asyncordefer. - Generally, all third-party scripts should be loaded by default with the use of either
asyncordefer.
<script defer src="…"></script>
<script async src="…"></script>
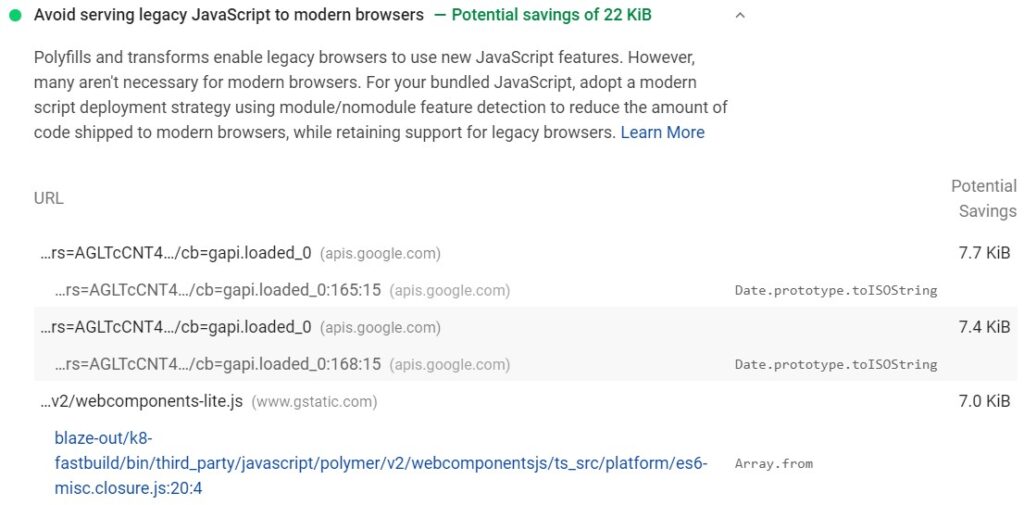
11. Check if unused polyfills are minimized.
Minimizing unused polyfills and optimizing their usage so that they are only used in the environments where they are required can significantly improve page-load metrics, such as Largest Contentful Paint.
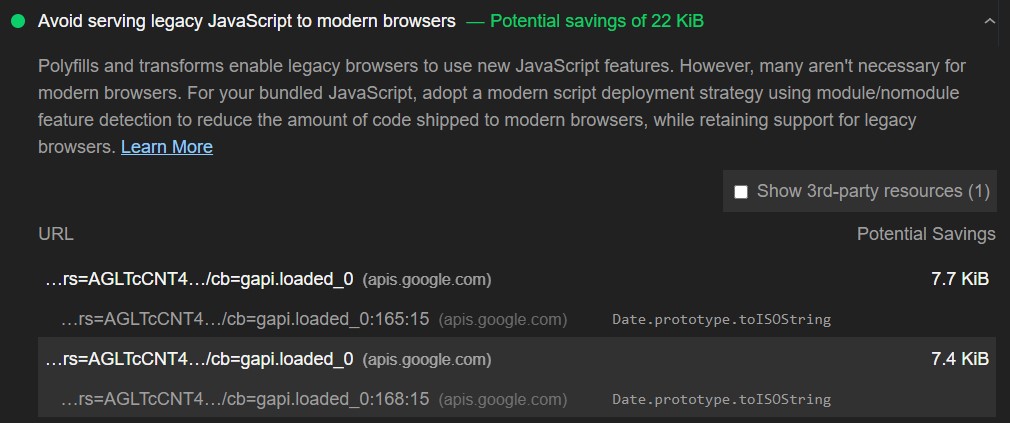
Modern browsers should not have to download transpiled code or polyfills unless they need to.
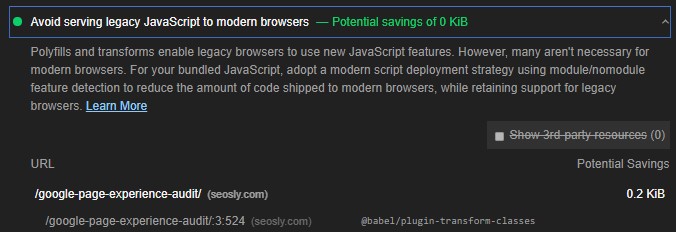
Here is what you can recommend:
- Websites using the Babel transpiler can use
@babel/preset-envto include only the polyfills required for the targeted browsers or enable the bugfixes option to even further optimize unneeded polyfills. - You can use
<script type="module">to block sending the transpiled code to browsers not needing it. - Deliver two separate bundles with the use of the module/nomodule pattern.
- It is the job of a developer to analyze the site and decide whether and how to optimize polyfills.
- The developer can learn more about optimizing unused polyfills here.
12. Check if images are optimized and compressed.
The time needed to load different types of resources can also impact the Largest Contentful Paint Score of the web page.
The types of resources that affect LCP include <img> elements, <video> elements, <image> elements in an <svg> element, elements with a background image loaded with url(), block-level elements with text nodes, and other types of inline text elements.
The best way to improve load times is by optimizing and compressing images.
Here is what you need to do, check and recommend:
- The Google PageSpeed Insights will indicate if there are any resources that need optimizing. The tool will also tell you what types of optimizations are recommended in a specific case.
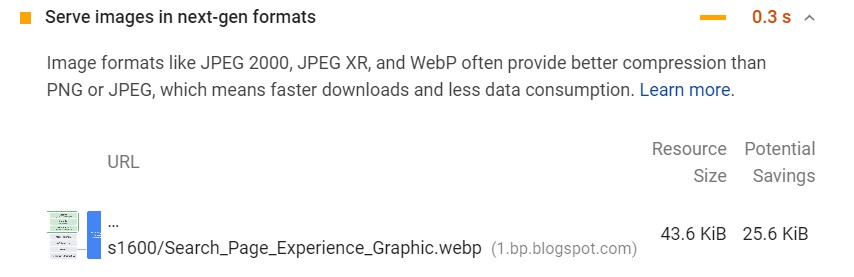
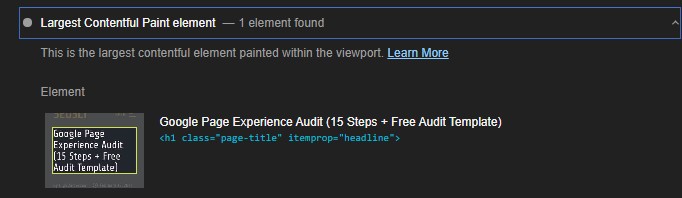
- Check if an image is the largest element in the viewport after the page has loaded. Common examples of this are banner images, large carousels, and hero images.
- Some of the ways to improve load and render times of images include:
- Avoid using an image as the main piece of content in the viewport.
- Compress images.
- Use responsive images.
- Convert images into new formats, such as JPEG 2000, JPEG XR, or WebP).
- In the case of WordPress sites, you can recommend using plugins, such as WP Rocket and Imagify.
13. Check if important resources are preloaded.
Preloading important resources can significantly improve the LCP score of a web page.
There are different types of resources that can be preloaded but it is important to preload only the critical assets, such as JavaScript, critical-path CSS, fonts, and above-the-fold images.
Here is what to do and recommend in your audit:
- Test the web page with the Google PageSpeed Insights tool. The tool will indicate if key requests are preloaded or not.
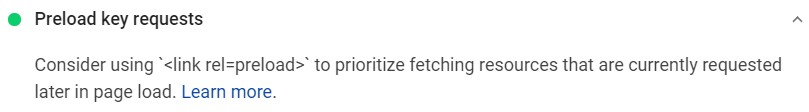
- If key requests are not preloaded, recommend using
<link rel="preload">to prefetch these resources early. - In the case of WordPress websites, you can automate this process by using a special plugin, such as WP Rocket.
14. Check if text files are compressed.
The compression of resources and text files can significantly improve the load times of a web page and thus reduce the Largest Contentful Paint score.
The size of text files, such as HTML, JavaScript, or CSS can be reduced a lot with the use of compression algorithms, such as Gzip or Brotli.
Here is what to do and recommend:
- Use the Google PageSpeed Insights tool to check if text compression is already enabled on the site. Many hosting platforms enable text compression by default.
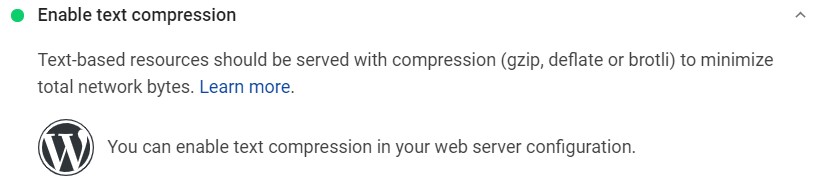
- If text compression is not enabled, recommend using either Gzip or Brotli.
- The Gzip compression is supported by all browsers but offers slightly worse compression results than Brotli which is supported by almost all new browsers.
- Note that assets should be compressed ahead of time instead of on-the-fly.
15. Check if adaptive serving is used.
Conditional fetching of assets depending on the user’s Internet connection type and the device can also significantly improve load times and LCP.
If the website has large assets that are critical for rendering, then it is a great idea to serve different versions of the same resource depending on the user’s device or connection.
Here is what you can recommend:
- If the site you are auditing does not use adaptive serving and it has huge assets that could be served conditionally, then you can recommend one of the following APIs:
- For example, you can recommend displaying an image instead of a video if the Internet connection is slower than 4G.
if (navigator.connection && navigator.connection.effectiveType) {
if (navigator.connection.effectiveType === '4g') {
// Load video
} else {
// Load image
}
}
This is a bit more advanced technique, so I recommend further reading on adaptive serving if you want to implement it on your site or recommend it to your client.
Largest Contentful Paint And Server-Side Rendering
The following three points of the Core Web Vitals audit are especially important for websites using frameworks and libraries, such as Angular, React, or Vue which in many cases render web pages on the client instead of on the server.
16. Check if critical JavaScript is minimized.
Rendering JavaScript mainly on the client can have a negative effect on the Largest Contentful Paint (especially if large JavaScript files are used).
If the JavaScript on the page is not optimized, then users may not be able to interact with the web page or see all of its content until all critical JS has been downloaded and executed.
The single best way to optimize sites that are rendered on the client’s side is to minimize the amount of JavaScript used.
Here is what to do and recommend:
- Test the web page with the Google PageSpeed Insights tool to see if JavaScript is optimized. The tool will indicate any opportunities in this regard.
- You can provide the recommendations from points 9, 10, and 11 which are:
- JavaScript minification
- Deferring unused JavaScript files
- Minimizing unused polyfills
- It should be the developer who makes the final decision on whether and how to optimize JavaScript on a particular site.
17. Check if server-side rendering is or can be used.
Using server-side rendering can also help improve the Largest Contentful Paint metric.
Server-side rendering works in such a way that the main content of the page is rendered on the server, not on the client. This can improve LCP significantly but, at the same time, it can increase server response times and make Time to First Byte (TTFB) and Time to Interactive (TTI) worse.
Here is what to do or recommend:
- Depending on how heavy JavaScript the website is and what its Largest Contentful Paint metric is, you can recommend using server-side rendering.
- Remember that in this case, it should be the developer who decides whether and how to implement server-side rendering.
- Google, fortunately, provides a lot of useful documentation on rendering and shares a lot of best practices.
18. Check if pre-rendering is used
Pre-rendering is yet another way to improve the Largest Contentful Paint metric.
Pre-rendering is less complex in comparison to server-side rendering but also can help improve LCP significantly. Just like with server-side rendering, pre-rendering can have a negative impact on Time to Interactive (TTI) but it does not affect server response times so much.
Here is what to check or recommended:
- Your recommendations should depend on how JavaScript-heavy the site you are auditing is and how that affects its LCP.
- If applicable, recommend the implementation of pre-rendering.
- Make sure that the developer analyzes the website and makes the final decision on what to implement.
There is a lot to be done to improve LCP, isn’t there? Let’s now analyze the remaining two metrics.
First Input Delay (FID)
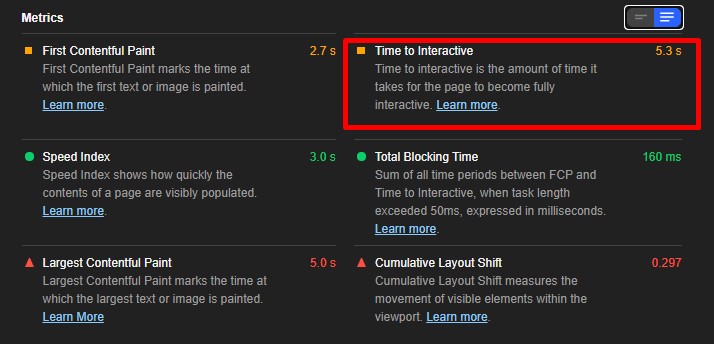
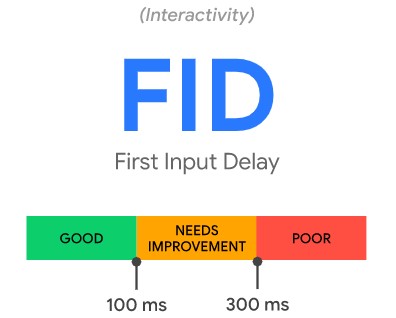
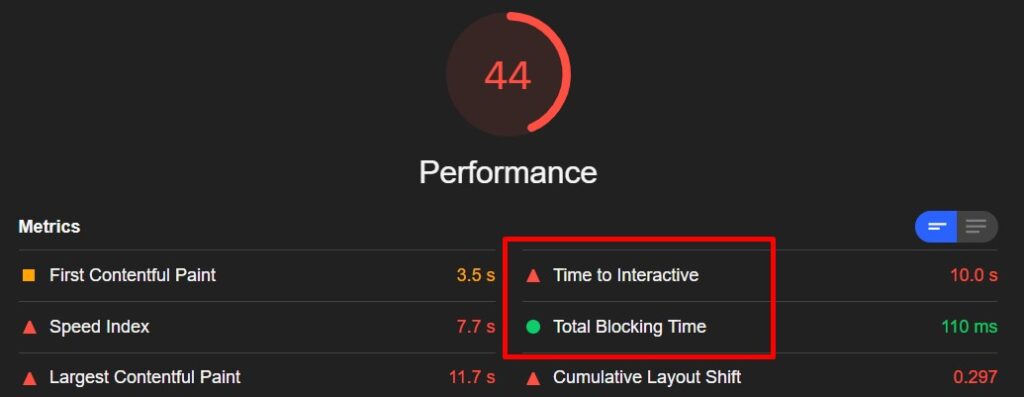
First Input Delay (FID) measures the interactivity of a web page. A website will provide a good user experience if its pages have an FID score equal to or below 100 ms.
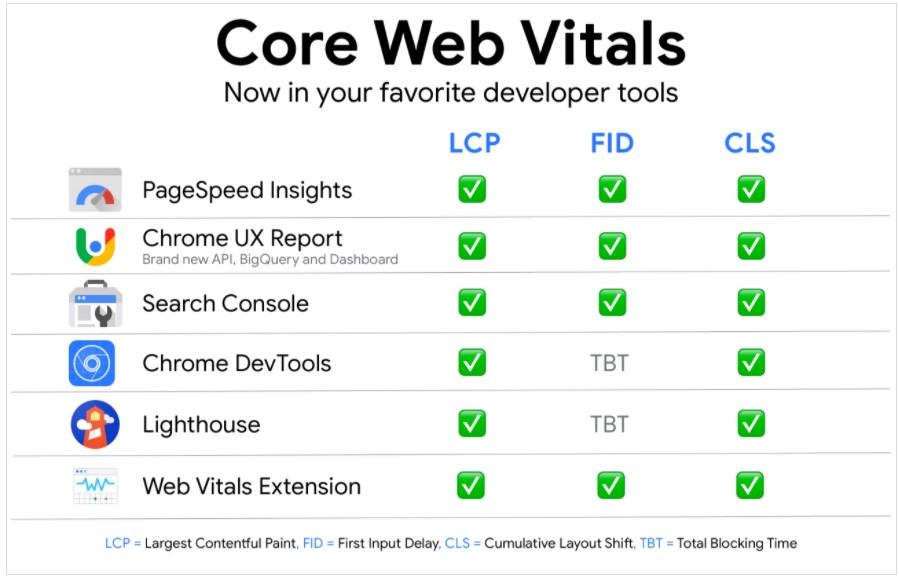
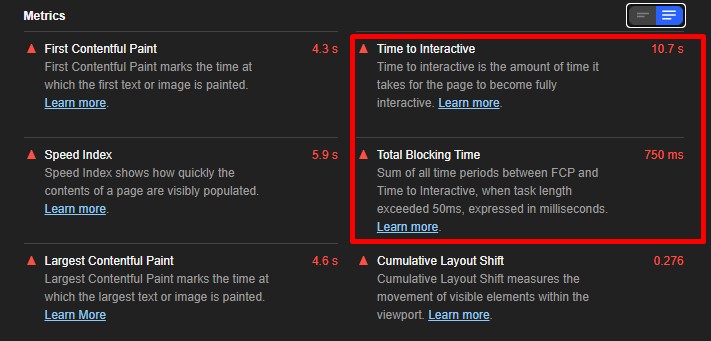
The First Input Delay requires real user input so it cannot be measured in the lab. Total Blocking Time (TBT) is the metric that is the closest to FID, correlates with FID, and can be measured in the lab. Time to Interactive (TTI) can also be used as a lab indicator for FID.
Improvements in Total Blocking Time (TBT) usually lead to improvements in First Input Delay (FID).
Heavy JavaScript execution is usually the main cause of a poor score of FID. Therefore, the best way to improve FID is to optimize the JavaScript parsing, compilation, and execution.
UPDATE: Google has recently introduced a new experimental metric – Interaction To Next Paint (INP) – which may replace FID.
The tools to measure FID:
- Google PageSpeed Insights (this is the tool you should use for auditing FID on a per-page basis assuming that the CrUX report has enough data for the site).
- Google Search Console (Core Web Vitals report) (this is an essential tool for checking the actual values of FID across the entire website)
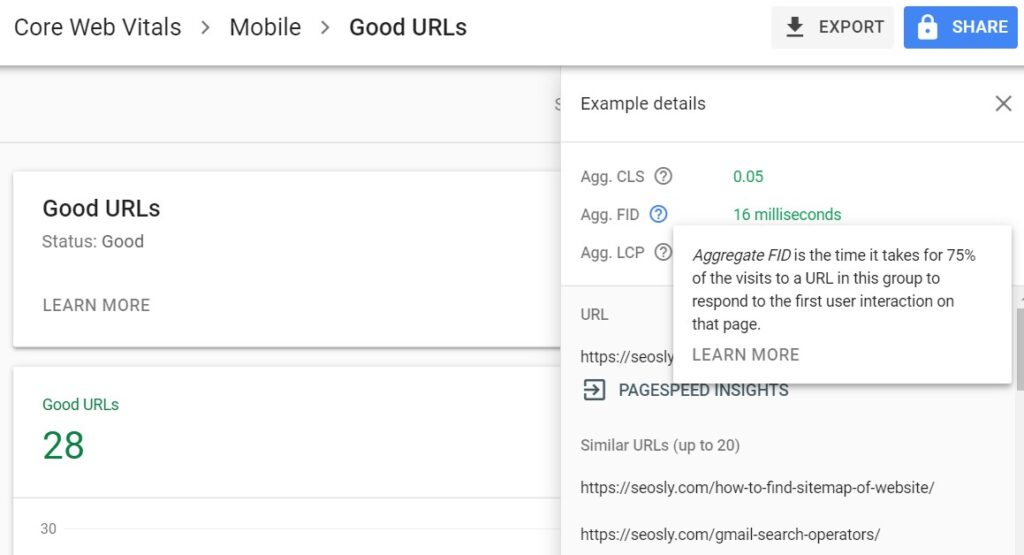
- Chrome User Experience Report (the CrUX data is used by PSI and Lighthouse)
- web-vitals JavaScript library (if you are a developer and want to use your own app to measure FID)
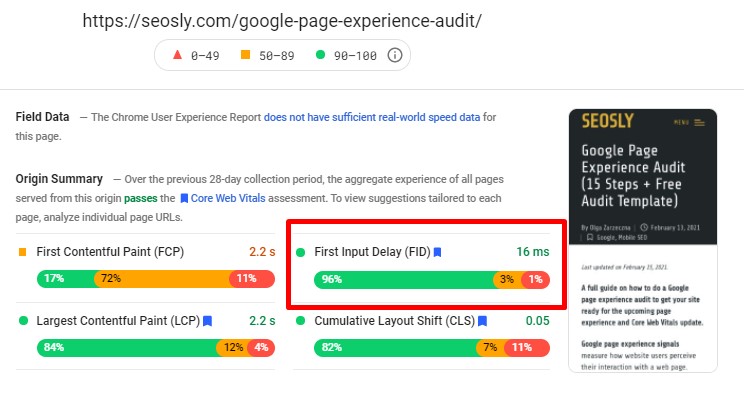
For the purposes of this audit, I recommend you use Google PageSpeed Insights and the GSC Core Web Vitals report to examine FID. Note that FID can only be measured based on field data.
Use lab tools, such as Chrome DevTools, Lighthouse, and WebPageTest to examine other metrics, such as TTI and TTB which correlate with FID and are also good indicators of interaction readiness.
⚡ Check my guide to First Input Delay to learn more about this metric.
19. Check if long JavaScript tasks are broken up.
Breaking up long JavaScript tasks into smaller asynchronous tasks can noticeably improve the First Input Delay.
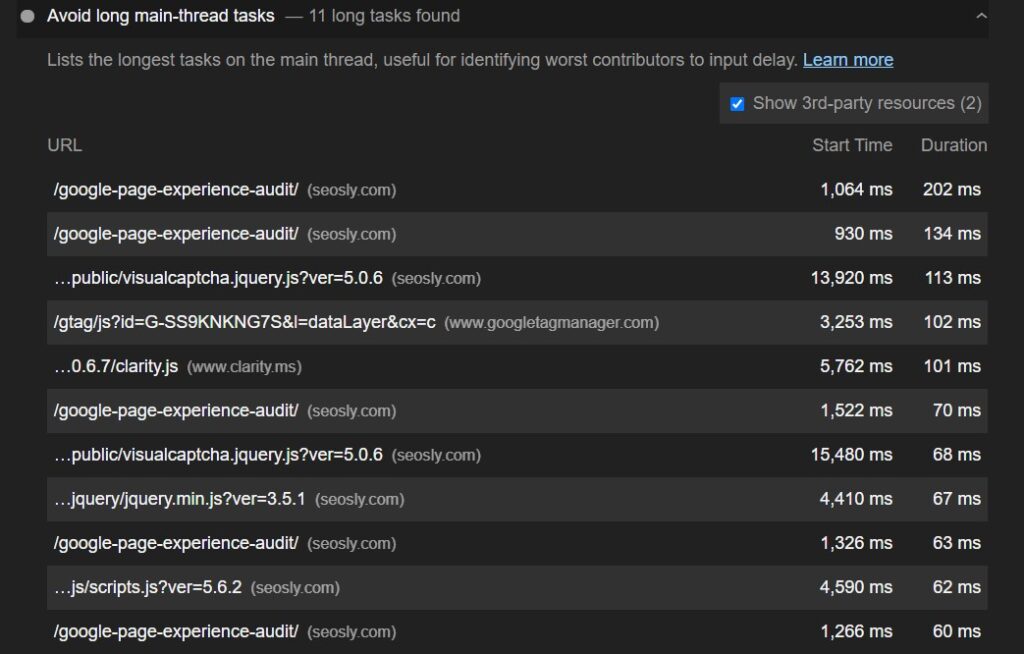
A long task is a piece of JavaScript code that blocks the main thread for 50 ms or more. During long JavaScript tasks, UI may be unresponsive. Long tasks are considered a sign of possible JavaScript bloat.
The best way to reduce the First Input Delay of a website is by splitting up long tasks.
Here is what to do and recommend:
- Use the Google PageSpeed Insights tool to check if there are JavaScript optimizations to be made.
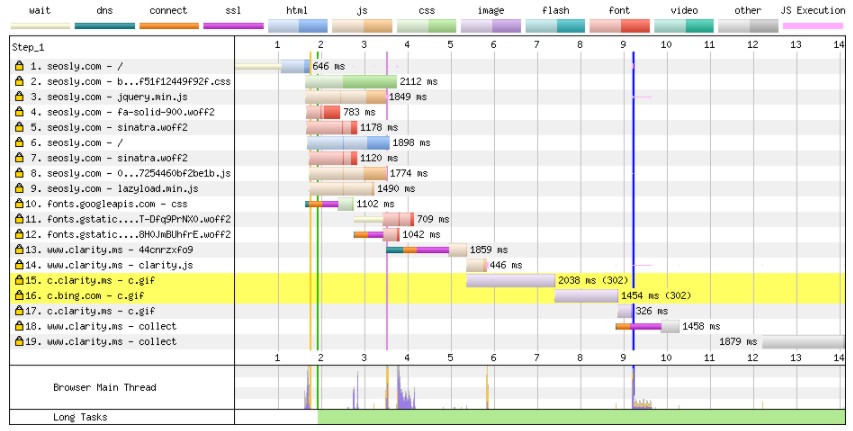
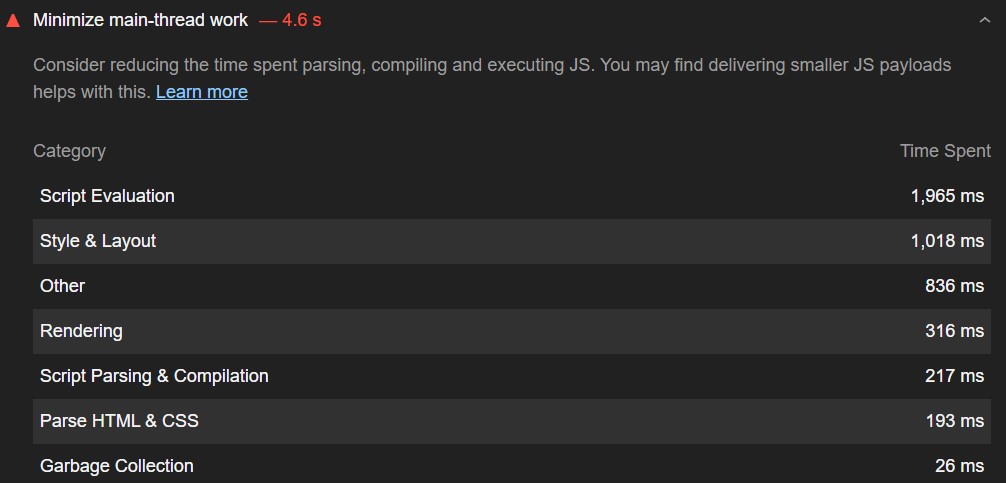
- Use the Chrome DevTools to check if there are any long tasks on the website.
- All you need to do is record a trace of the loading of a web page (in the Performance panel). All tasks are shown in grey and long tasks have red flags.
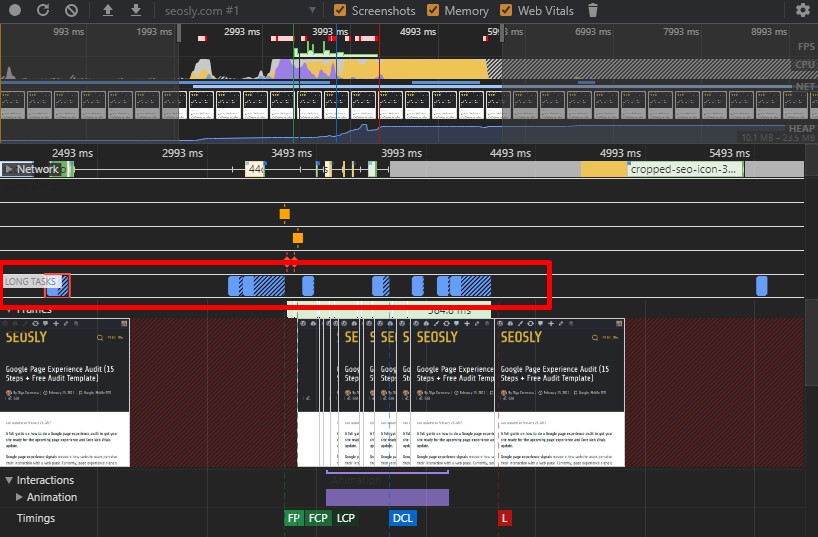
- You can also use Lighthouse to check if there are long tasks.
- Analyze long tasks and provide your feedback to the developer suggesting that these long tasks should be broken up into smaller ones.
- You can learn more about long JavaScript tasks on web.dev.
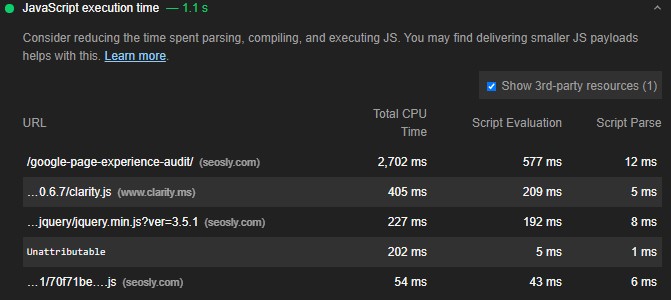
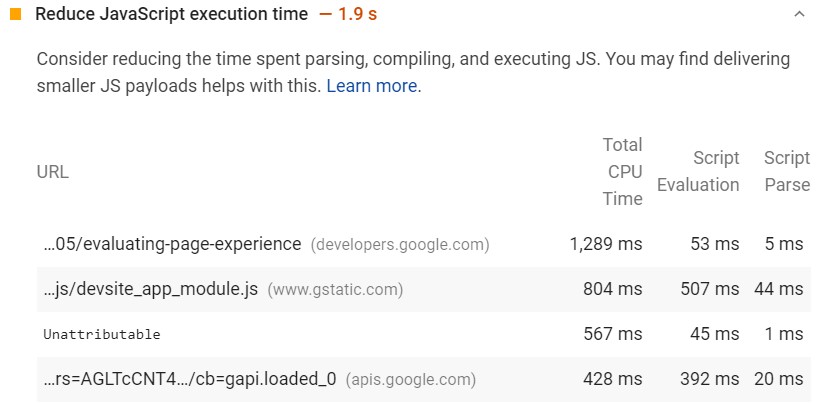
20. Check if first-party script execution negatively impacts interaction readiness.
Inefficient first-party script execution influences the interactivity of the website and the metrics, such as FID, TBT, and TTI.
The main causes of delays in interaction readiness are JavaScript bloat, heavy JavaScript execution times, inefficient chunking, and large script executions.
Here is what you can do or recommend:
- Test the site with Google PageSpeed Insights or Lighthouse and check the scores of the metrics that influence interaction readiness.
- The metrics to check include First Input Delay (FID), Total Blocking Time (TBT), and Time to Interactive (TTI).
- You can also use Chrome DevTools to check the metrics corresponding to FID.
- Report your findings in the audit. You can recommend the following:
- Progressive loading of code.
- Server-side rendering or pre-rendering depending on the type of the website and the application.
- Removing non-essential scripts from the critical rendering path.
21. Check if data-fetching negatively impacts interaction readiness.
Data-fetching can also have a negative influence on many aspects of the site’s interaction readiness.
This usually takes place if a website relies on cascading data fetches and if a lot of the script execution takes place on the client.
Here is what you can do and recommend:
- Depending on the scores for FID, TTI, and TBT reported by Google PageSpeed Insights or Lighthouse, you can recommend some JavaScript data-fetching optimizations.
- The JavaScript optimizations to recommend include tactics, such as:
- Minimizing cascading data fetches.
- Minimizing the amount of JavaScript to be processed and executed on the client.
- The tactics I shared with you earlier in this guide (JavaScript minification and compression, deferring unused JavaScript, and minimizing unused polyfills).
- Note that it should be the developer who makes the final decision on how to optimize JavaScript on the website.
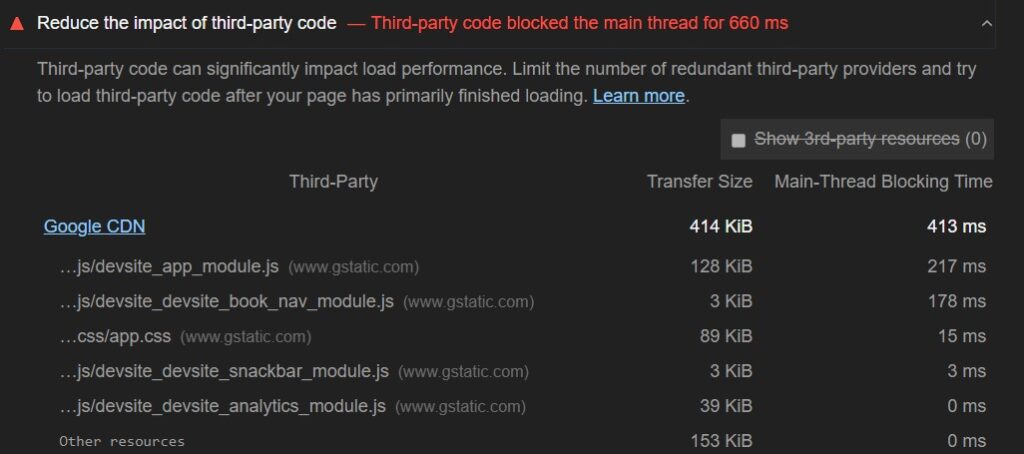
22. Check if third-party script execution negatively impacts interaction readiness.
Third-party script execution (especially if it is heavy) can have a negative impact on the site’s interaction latency.
Third-party scripts can keep the main thread periodically busy and unresponsive. Fortunately, there are a few third-party script execution best practices, such as on-demand loading.
Here is what you can do and recommend:
- Test the website with Google PageSpeed Insights to see if third-party scripts negatively influence metrics, such as FID, TTB, and TTI.
- Check if the site includes third-party analytics and tags impacting interaction latency.
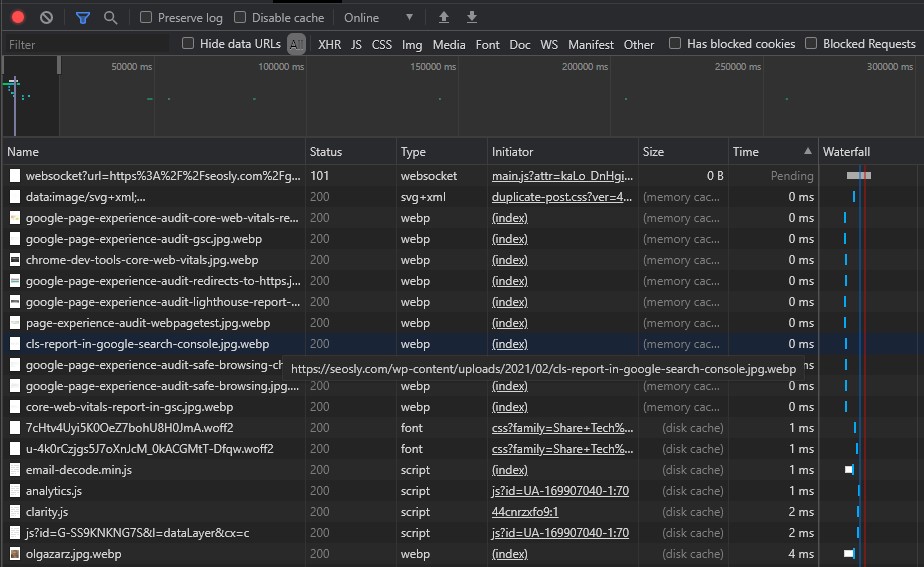
- Check if third-party scripts pre-empt first-party scripts when it comes to their priority and bandwidth on the main thread. You can check that in Chrome DevTools under Network.
- Report your findings and suggest possible optimization techniques, such as:
- Loading below-the-fold ads after they have been scrolled closer to the viewport
- Prioritizing the loading of scripts.
- The final decision on what scripts should be loaded earlier or later should be made by the developer.
23. Check if a web worker is or can be used (Comlink, Workway, Workerize).
Thanks to web workers, JavaScript can be run on a background thread, which can decrease the main thread blocking time and improve FID.
One of the main causes of long input delay and overall poor interaction readiness is a blocked main thread.
Here is what to do and recommend:
- Test the website with Google PageSpeed Insights, Lighthouse, and Chrome DevTools to check if the main thread is blocked and what blocks it.
- Depending on the type of the website, you can recommend using one of the following web workers:
- Comlink
- Workway
- Workerize
- Just like with the previous points, this should be the developer to make a final decision on what optimizations to implement exactly.
24. Check if unused JavaScript is deferred (see point 10).
One of the best ways to reduce the amount of JavaScript to be executed on a web page is by deferring or entirely removing unused JavaScript.
By deferring unused JavaScript you can improve both Largest Contentful Paint and First Input Delay.
Go back to point 10 to see more detailed instructions on deferring unused JavaScript.
25. Check if unused polyfills are minimized (see point 11).
Another great way to reduce the JavaScript execution time is by minimizing unused polyfills.
By minimizing unused polyfills you can improve both FID and LCP.
Go back to point 11 to see more detailed instructions on minimizing unused polyfills.
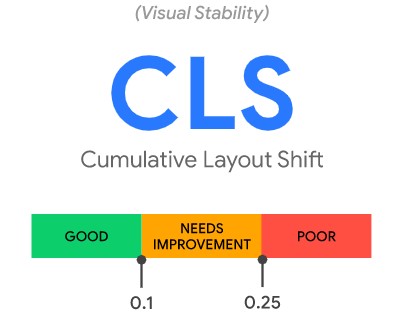
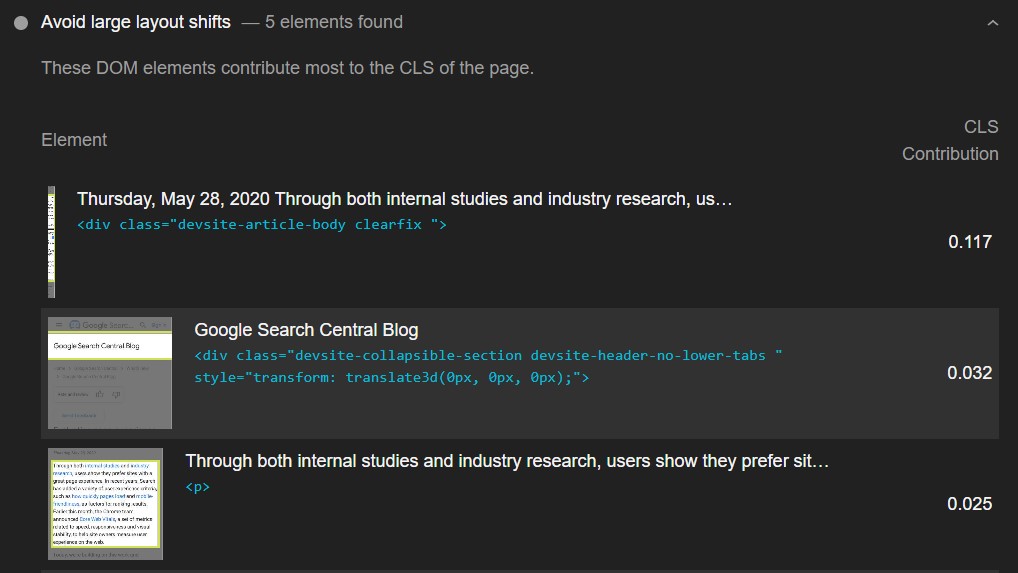
Cumulative Layout Shift (CLS)
Cumulative Layout Shit (CLS) measures the visual stability of a website. A website will provide a good user experience if the CLS of its pages is equal to or below 0.1.
Fortunately, there are a lot of tools you can use to measure CLS.
Lab tools test pages in a synthetic environment so the CLS values reported by them may differ from what real-world users experience when interacting with the site.
The field tools to measure Cumulative Layout Shift:
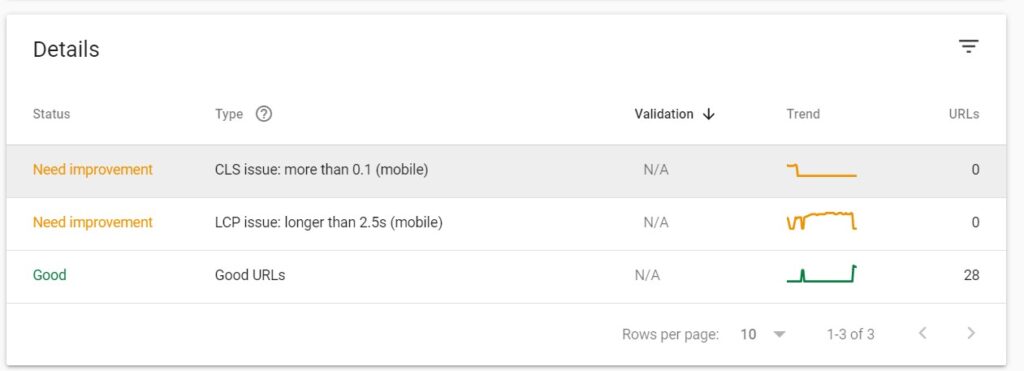
- Google PageSpeed Insights (an essential tool for measuring CLS on a per-page basis)
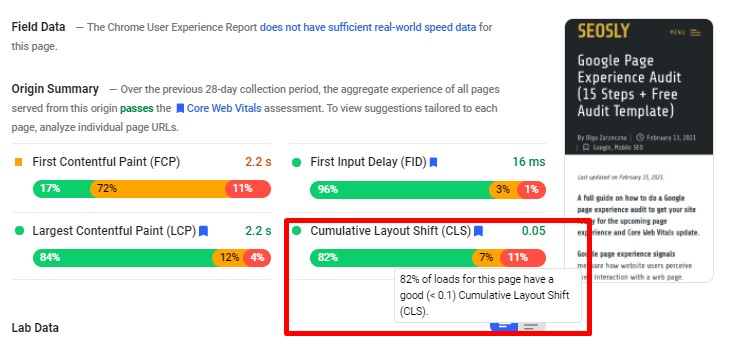
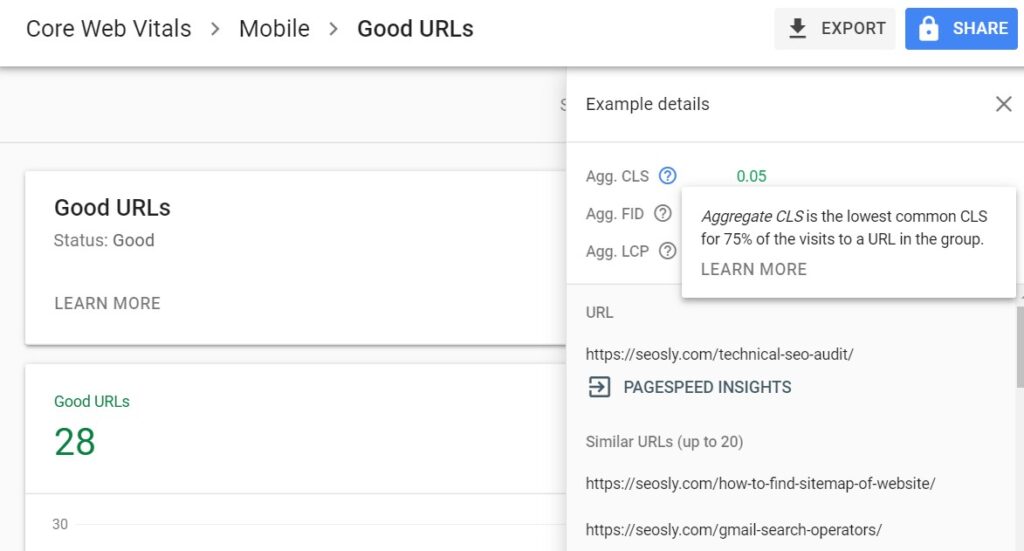
- Google Search Console (Core Web Vitals report) (an essential tool to audit CLS across the entire website based on real-world data).
- Chrome User Experience Report (the data from the CrUX report are used in GSC, PSI, and Lighthouse)
- web-vitals JavaScript library (the solution you may want to use if you are a developer)
The lab tools to measure Cumulative Layout Shift:
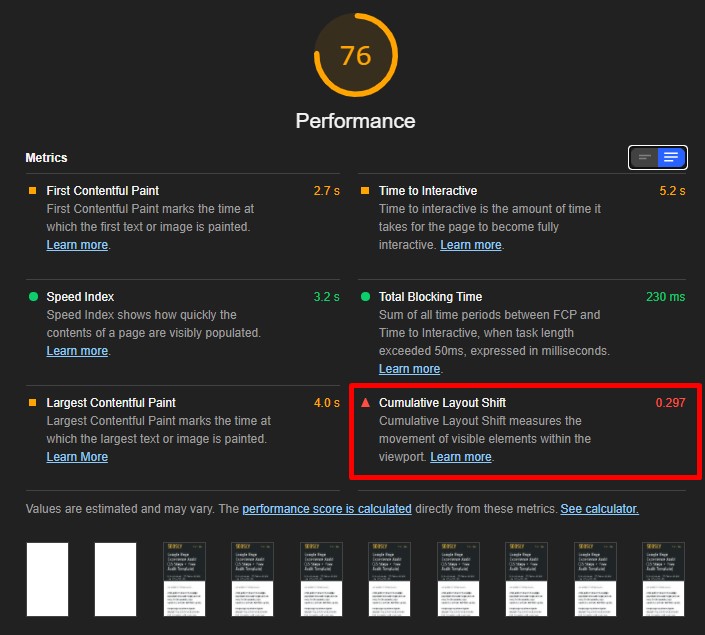
- Chrome DevTools (ideal for auditing CLS in detail in the lab environment)
- Lighthouse (ideal if you want to test your optimizations in real-time)
- WebPageTest (if you are a geek and want to dig deep into the data on Core Web Vitals and how the page loads, this is the tool for you)
- Cumulative Layout Shift Gif Generator (a very fun tool)
For the purposes of this audit, I recommend you use Google PageSpeed Insights and the GSC Core Web Vitals report to examine field data on CLS.
Regarding lab data, use Chrome DevTools, Lighthouse, and WebPageTest to analyze CLS using different settings and screen resolutions. Cumulative Layout Shift Gif Generator can also be a lot of fun. The more tools you use, the better and the more in-depth your audit will be.
⚡ Check my guide to Cumulative Layout Shift.
26. Check if there are image or video elements without dimensions.
Images and videos without the dimensions specified (especially in the above-the-fold section) can cause layout shifts.
To avoid layout shifts the rule of thumb is to always include the height and width attributes on images and videos. It is also possible to use the CSS aspect ratio boxes that will let the browser allocate the necessary amount of space while the image or video is being loaded.
Here is what to do and recommend:
- Test the website with Google PageSpeed Insights and Lighthouse and – depending on the CLS score – recommend reserving the correct amount of space for image or video elements.
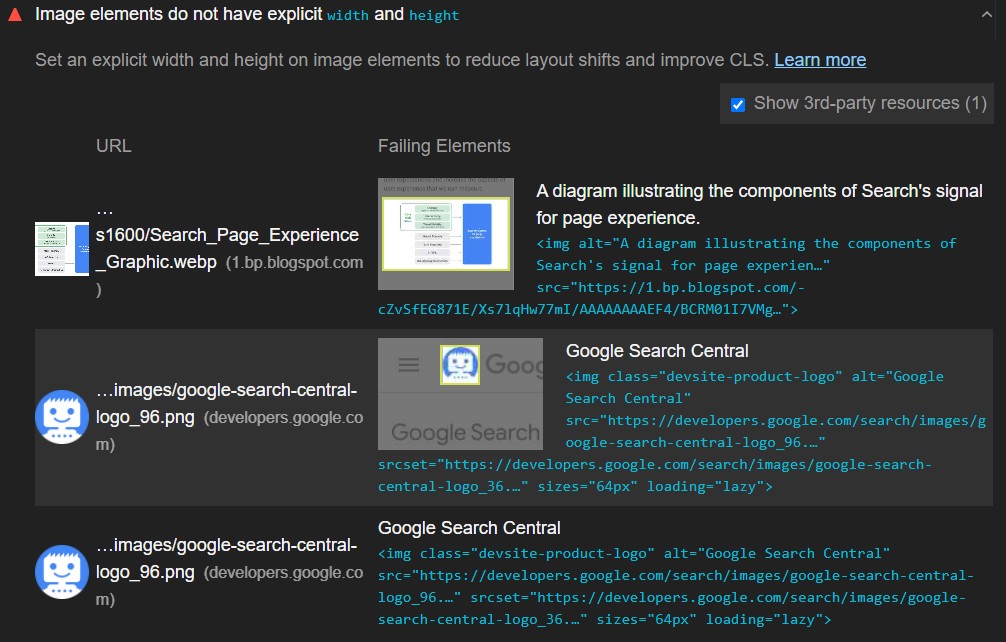
- Recommend that the width and height size attributes be set as normal. Here is the example code:
<!-- set a 640:360 i.e a 16:9 - aspect ratio -->
<img src="puppy.jpg" width="640" height="360" alt="Puppy with balloons" />- All modern browsers will set the default aspect ratio of images based on the sizes specified, which will prevent layout shifts.
❗ In the case of WordPress websites, these optimizations can very often be done automatically with the use of a plugin. I recommend using WP Rocket.
27. Check if there is statically reserved space for the ad slot.
Ads – especially if they are dynamic – are one of the most popular causes of layout shits on websites.
There are many ways in which ads can cause layout shits on a page. The most common situation includes inserting the ad container in the DOM and resizing the ad container.
The best way to avoid these types of layout shifts is to statically reserve space for the ad slot.
Here is what you can do and recommend:
- Test the web page with the Google PageSpeed Insights tool to check its CLS score.
- If possible, analyze the data provided by the GSC Core Web Vitals report.
- I also recommend analyzing the Cumulative Layout Shift score with other tools (such as Chrome DevTools, Lighthouse, and WebPageTest) and using different screen resolutions.
- If there are issues with CLS, determine if this is the ad to blame. If it is the ad, you can recommend one of the following:
- Statically reserve space for the ad slot by styling the element before the ad tag library is loaded.
- Ads placed in the content flow should also have the slot size reserved but they should not cause CLS issues if they are loaded off the screen.
28. Check if ads are placed near the top of the viewport.
Ads placed near the top of the viewport (non-sticky ads) can also lead to the poor score of the CLS metric.
The sites using non-sticky ads in the top part of the viewport should take extra caution to avoid or minimize layout shifts.
Here is what you can do and recommend:
- Check the page with the Google PageSpeed Insights tool to see its CLS score.
- The Google Search Console Core Web Vitals report also contains invaluable field data on CLS.
- Check the CLS metric value reported by other tools, such as Chrome DevTools and WebPageTest. Make sure to run tests with different screen resolutions.
- If there are issues with CLS, determine if this is the ad to blame.
- If it is the ad that is placed near the top of the viewport, then you can recommend:
- Moving the ad below so that it is not placed near the top of the viewport or moving it completely off the first screen.
- Reserving enough space for the slot (as recommended in the previous point).
⚡ Check my guide to intrusive interstitials which are one of the Google page experience signals.
29. Check if the reserved space is collapsed when there is no ad returned.
Layout shifts can also occur if the reserved ad space is collapsed when no ad is returned.
The best way to avoid this type of layout shift is to show the ad placeholder even if the ad is not returned.
Here is what you can do and recommend:
- Test the web page with more than one tool to see how it behaves in different ad scenarios.
- It may be quite challenging to replicate the situation where no ad is returned and the reserved space is collapsed. You may try to block the ad code and examine what happens (you can use an ad blocker for that).
- If the reserved ad space that collapses is the main culprit, then you can recommend the following:
- Reserving the largest possible ad slot.
- Always showing the ad placeholder.
- The above recommendations may result in a blank space but will prevent layout shifts.
30. Check if enough space is reserved for embeds and iframes.
Embeds, such as YouTube videos, Google maps, or social media posts can also cause layout shifts if not enough space is reserved for them.
Embeds can take a form of an iframe embed, inline HTML snippet, or an HTML fallback with a JS tag, The platforms which allow embedding (WordPress, for example) do not always know what the size of an embed is going to be and thus do not reserve enough space for those embeds. This, obviously, leads to layout shifts.
Here is what you can do and recommend:
- Test the web page with more than one tool to analyze different scenarios of cumulative layout shifts.
- If you find out that it is an embed that is to blame for the poor CLS score of a website, then you can recommend the following:
- Precompute the space necessary for embeds with a fallback or placeholder.
- Determine the size of the embed by inspecting it with DevTools.
- Style a placeholder taking into account the dimensions of the embed inspected.
- Make sure the developer makes the final decision on what should be implemented and how.
31. Check if new content is inserted above the existing content.
Unexpected layout shifts may occur if new content is inserted above the existing content (e.g. content that pops up at the bottom or top of the viewport).
These types of cumulative layout shifts are often caused by banners and forms shifting the rest of the content. They often include elements, such as newsletter signups, related content boxes, or cookie notices.
The only situation where it is OK to insert new content above the existing content is when it is done in response to user interaction.
Here is what you can do and recommend:
- Examine the web page in detail with the use of at least 2-3 of the recommended tools to check different layout shift scenarios.
- If you determine that new content being inserted on top of existing content is to blame, you can simply recommend reserving the necessary space in the viewport (similar to what you should do with ads). This can be done by either using a skeleton UI or a placeholder.
32. Check if the fallback font is swapped with a new font (FOUT)
The Flash of Unstyled Text (FOUT) that may happen during the process of downloading and rendering fonts can cause layout shifts.
The Flash of Unstyled Text appears when the fallback font on a web page is swapped with a new font during loading.
Here is what to do and recommend:
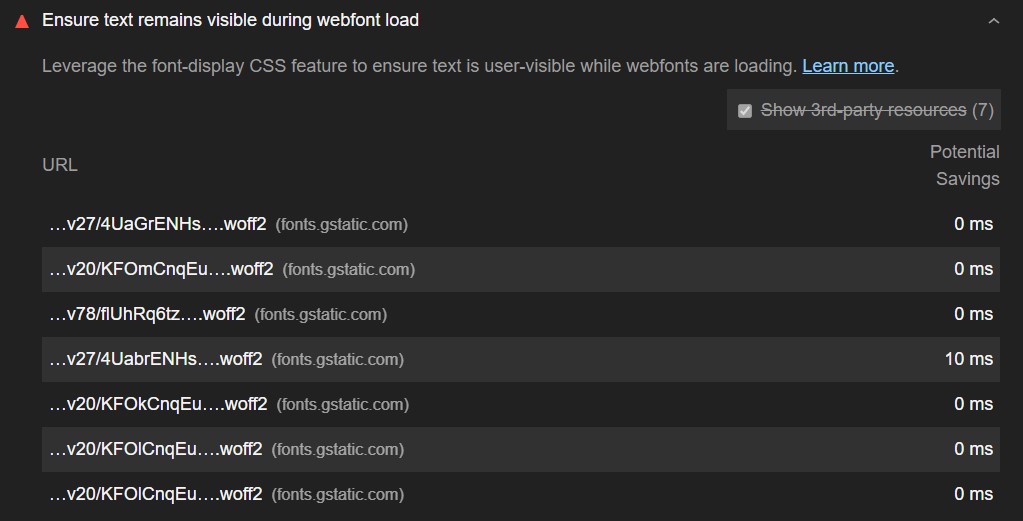
- The Google PageSpeed Insights tool will indicate if the web page has problems with fonts causing FOUT.
- Recommend using
font-display: optionalor/and using<link rel="preload">. - The best fix to recommend here is to preload optional fonts.
33. Check if “Invisible” text is displayed until a new font is rendered (FOIT)
The Flash of Invisible Text (FOIT) is another common issue that may cause layout shifts on a web page.
The Flash of Invisible Text occurs when “invisible” text is displayed during the process of rendering web fonts.
The recommendations and fixes are the same as above (for FOUT).
34. Check if key web fonts are preloaded.
If the site does not preload web fonts, then it is very likely to have layout shifts during the rendering and preloading process.
The best way to avoid any layout issues caused by web fonts is to preload key fonts with the use of <link rel="preload">.
The recommendations and fixes:
- Test the web page with Google PageSpeed Insights and the Google Search Console Core Web Vitals report.
- The Google PageSpeed Insights tool will indicate if there are any issues with font rendering or downloading.
- If you determine that these are web fonts that cause layout shifts, you should recommend the following:
- Using
font-display: optional - Using Font Loading API
- Using
<link rel="preload">for key web fonts - Combining
<link rel="preload">with font-display: optional
- Using
35. Check if there are animations of properties that trigger layout changes.
Some CSS properties may trigger layout shifts that lead to a poor user experience.
The simplest way to avoid layout shifts resulting from changes to CSS property values is to use transform animations instead of animations of properties.
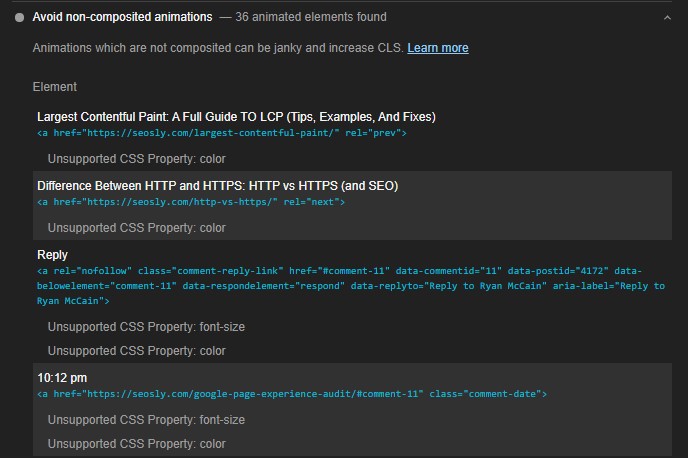
Examples of values that may cause layout shifts include box-shadow and box-sizing.
Here is what to do and recommend:
- Test the web page with Google PageSpeed Insights and WebPageTest.
- Analyze the waterfall and determine what causes layout shifts.
- If you think that animations of properties are to blame, check further reading on CSS triggers and high-performance animations.
To give the website an SEO advantage, I also recommend you do an in-depth SEO audit that checks the website in terms of technical optimizations. And check my list of 100+ SEO mistakes.
This is brilliant, thank you so much for taking the time and putting all these wonderful resources together on one page!
Just WOW. My website was upgraded 2 month ago and now I know what programmers have done with my website 🙂
Dziękuję 🙂 Thank you for a nice comment and sharing my article 🙂
Nie ma problemu 🙂
Epic article! Thanks!
You are welcome!
Good insights and hands on recommendations. ????????
Thank you Elias 🙂
Hey, this is a really good insight over complete CWV. May I know how can I get the Audit template? Thanks
Hi! Thanks 🙂 Just subscribe to the newsletter and you will get it automatically to your inbox.
Hi Olga, I love you article, do you mind to share with me the template ?
Thanks
Really insightful article. Thank you for such an informational guide to Core Web Vitals.
Oof, that’s a lot of information… Thank you so much for amount of work you did here, it’s really helpful! Pozdrawiam 🙂
It’s a masterpiece written by you, Olga Zarr! Liked the way you covered every aspect of CWV.