
Updated: June 9, 2023.
A full guide on how to audit a site with JetOctopus, an SEO crawler that you should add to your SEO toolkit.

A technical SEO audit is one of the SEO tasks that you can perform only with the help of the right tool. JetOctopus – an enterprise cloud SEO crawler and a log analyzer – is definitely that tool.
In this guide, I will show you step by step how to audit your site with JetOctopus.
Ready for a cool technical SEO audit exercise? Awesome. Let’s dive into it!
Basic information about JetOctopus and the why
If you don’t know JetOctopus yet, you are probably curious why I recommend you use that tool for your next technical SEO audit. Here is why:
- JetOctopus is the fastest cloud-based crawler on the market, which means you definitely want to use it when crawling huge websites that have thousands (or millions) of web pages. It can crawl at the speed of 250 pages per second and there are no domain, project, or user limits.
- JetOctopus is also a very simple and visualized log analyzer that also offers real-time log analysis. It recognizes 40 types of bots and lets you analyze their behavior in real time.
- JetOctopus provides the SEO efficiency chart that connects 3 datasets – logs, crawl data & GSC data – to show you how efficient your site is in terms of SEO and how its crawling budget is spent.
- JetOctopus also visualizes the data from GSC, which allows you to better understand what GSC is telling you and draw the right conclusions.
- JetOctopus is the most affordable SEO crawler on the market.
☝️ Please note that you can use
Setting up a new crawl with JetOctopus
Let’s now begin the fun part. Here is what you need to do to get started.
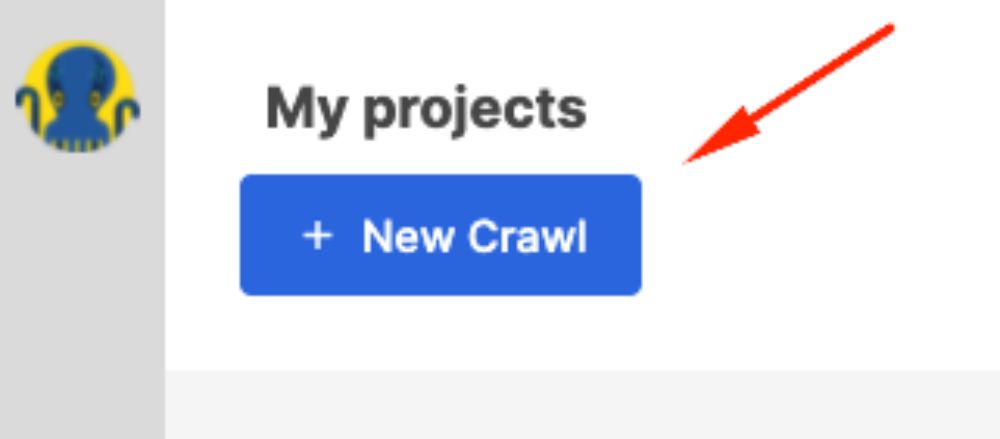
1. Log in to JetOctopus and click + New Crawl.
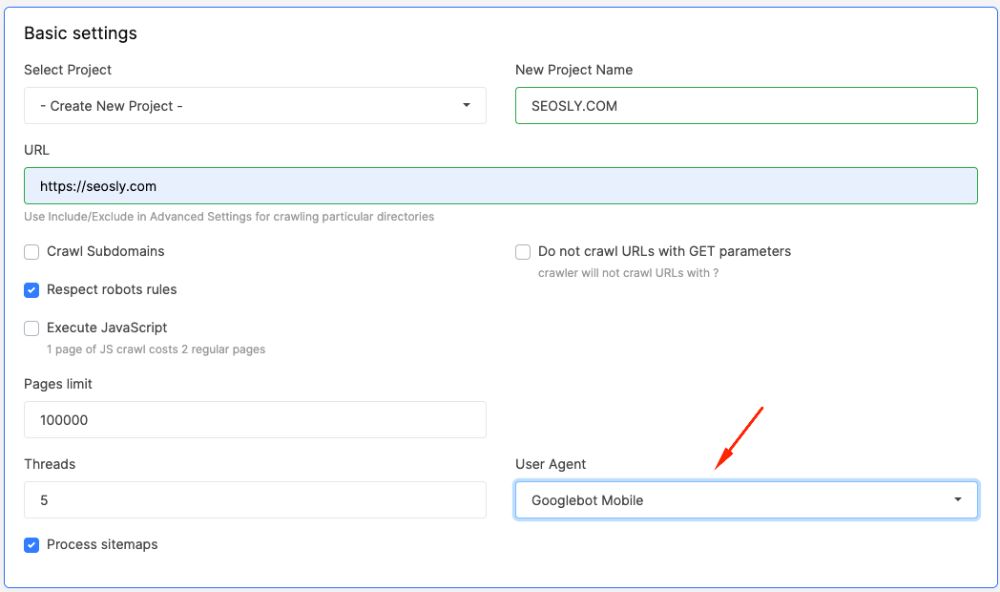
2. Under Basic settings create a new project, give it a name, enter the URL, and choose the user-agent (Googlebot Mobile preferably). Make sure to check Execute JavaScript.
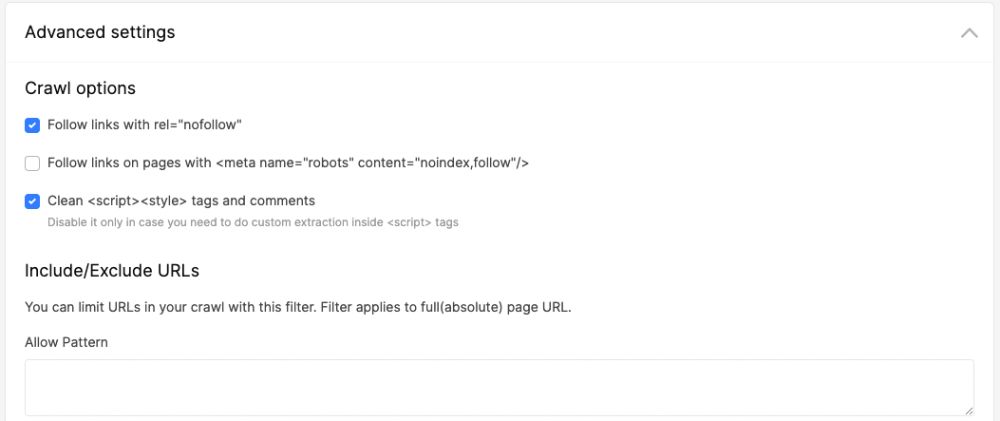
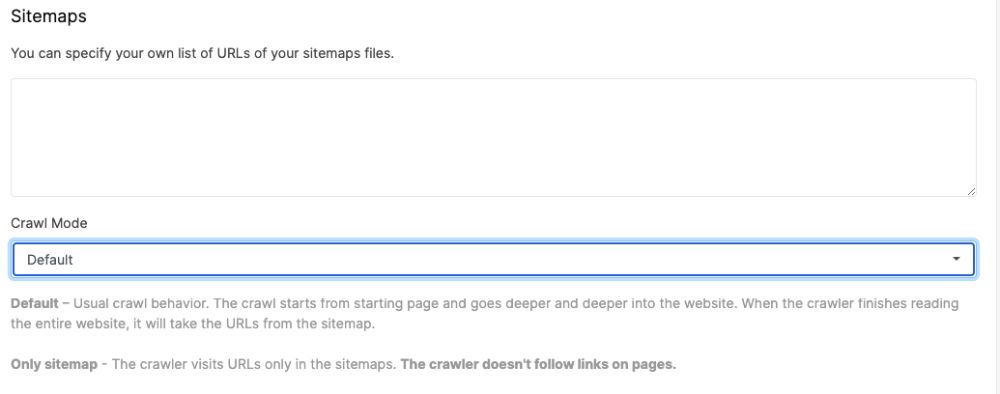
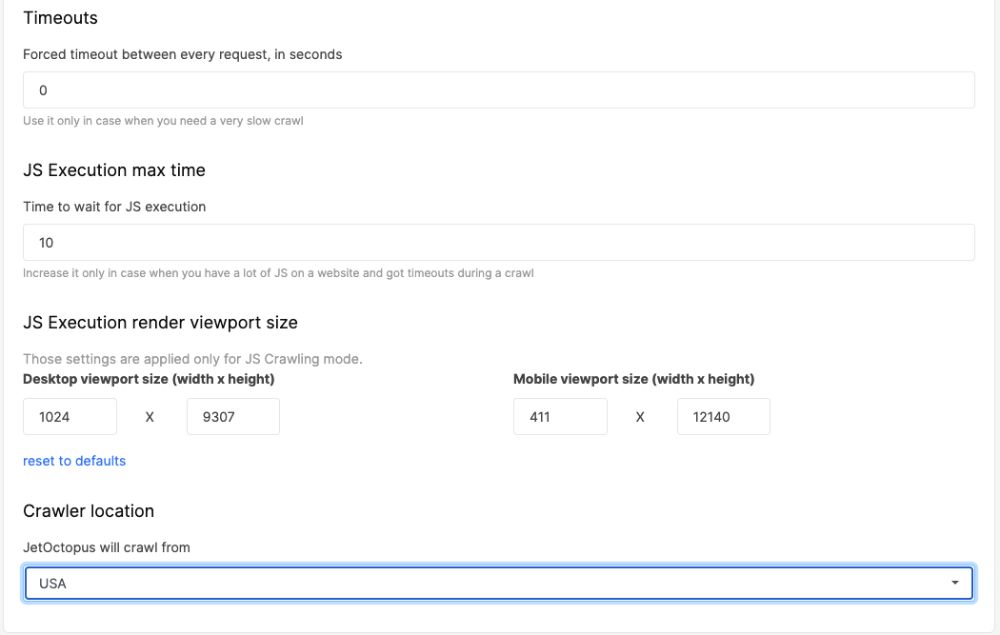
3. Under Advanced settings you can customize the crawl even further, i.e. include/exclude certain URLs, specify your own list of sitemap URLs, add authentication credentials, define timeouts and JS execution max time, and choose the crawler location (France, USA, Australia, or Russia).
- If your sitemaps are not in a standard location and are not indicated in robots.txt, then you should specify their location in Advanced settings.
- JetOctopus crawls very quickly (250 pages per second) so if you are worried about your server, you may want to define timeouts.
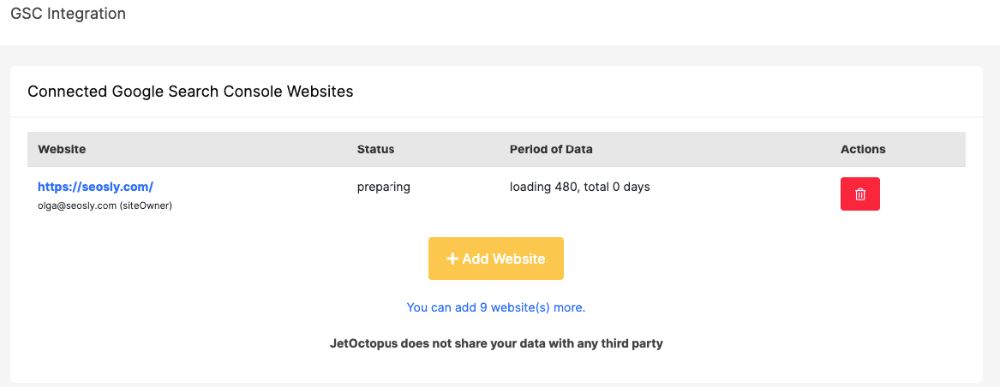
4. Under Google Search Console you can choose to integrate JetOctopus with your GSC data. If you do that, you will have even more insight after the crawl.
5. Everything set up? Click Start Crawl and wait until the crawl is complete.
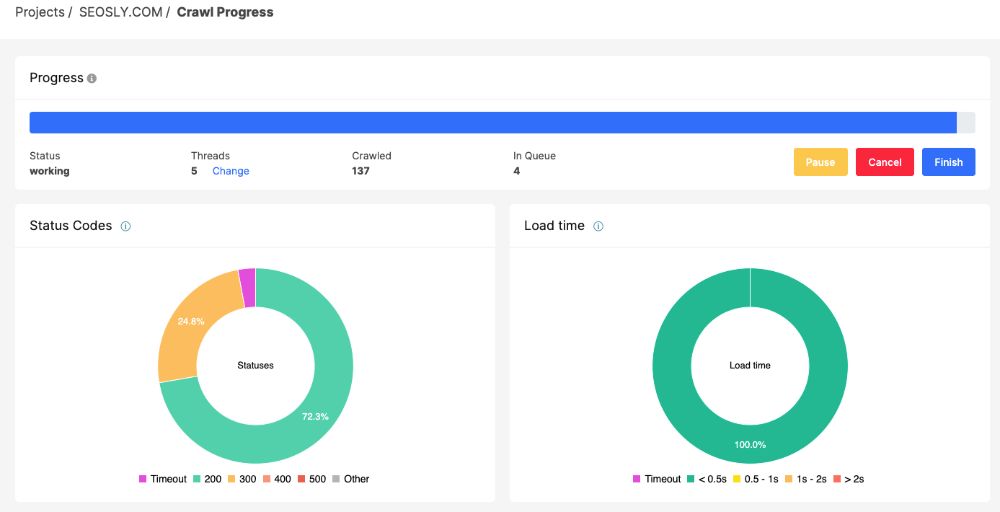
In the case of my (small) website, the crawl took less than a minute. That’s crazy!
Making sense of the JetOctopus crawl data
Once the crawl is complete, you will get an e-mail with its summary, which is very useful in the case of huge websites that cannot be crawled within seconds like my site.
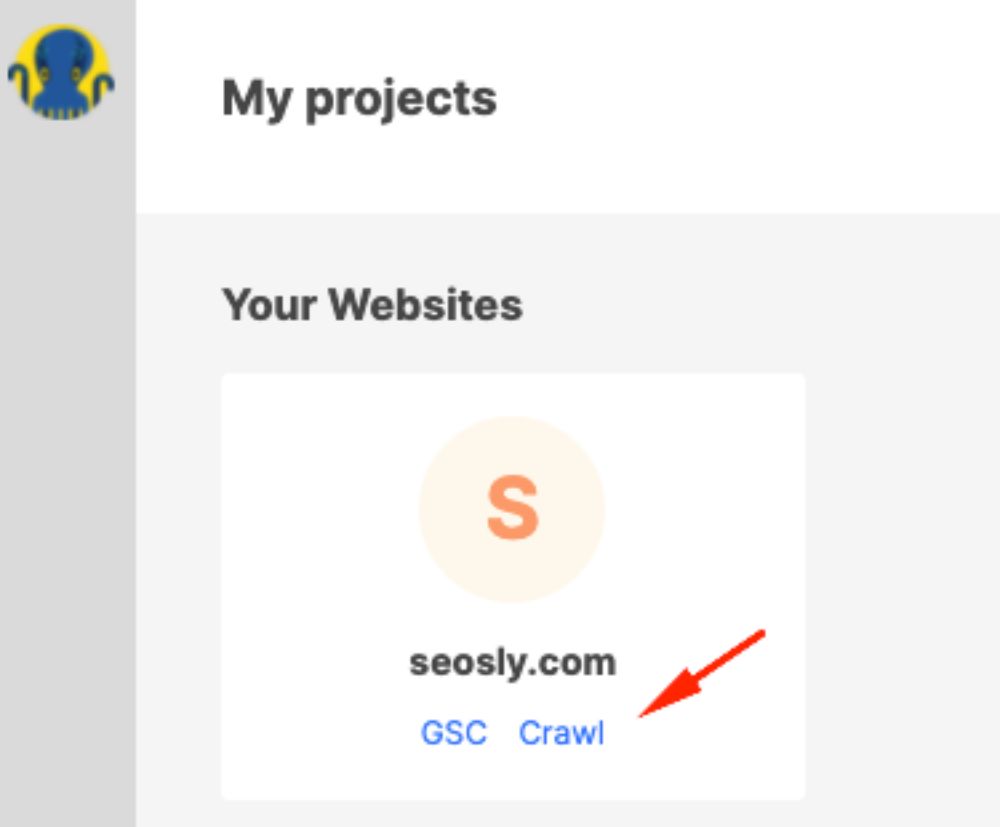
To analyze the crawl data, log in to JetOctopus and click on Crawl under the site.
Jet Octopus Crawler
The Crawler section contains all the data from the last crawl. The data is nicely visualized and grouped into different categories.
Let’s briefly talk about each section of the JetOctopus crawler data.
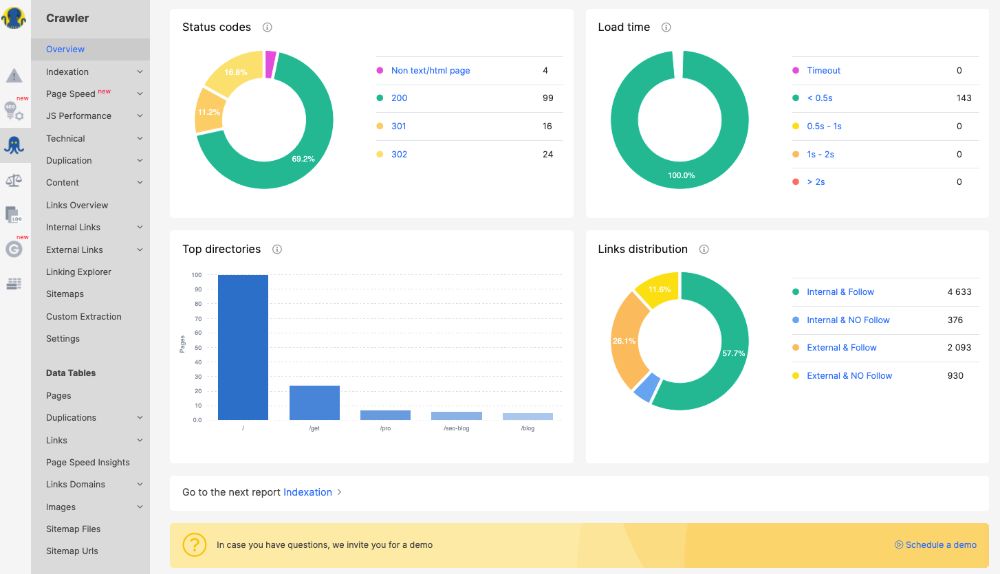
Overview
In the Overview section, you will see the summary of the crawl data, i.e. the number of crawled pages, known pages, pages with critical issues, pages with warnings, problems divided by categories and depth, indexability status, status codes, load times, top categories, and link distribution.
You can also export the overview data or save it as a PDF.
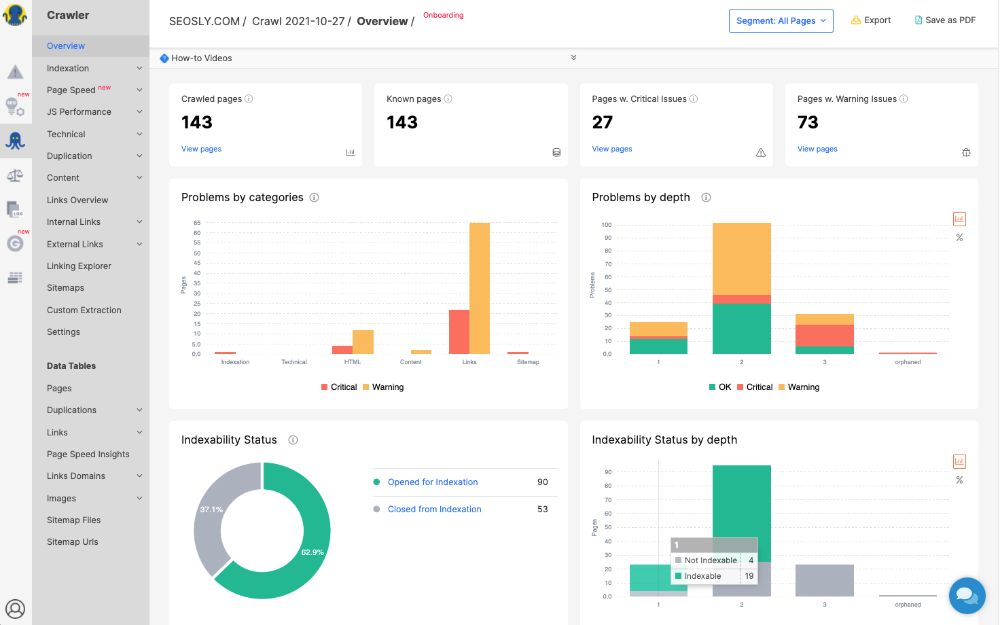
To quickly review the issues the crawler detected, navigate to Pages w. Critical issues and Pages w. Warning Issues.
Indexation
In the Indexation section, you can take a deep look at the indexation information about the site. JetOctopus displays the data about:
- The pages blocked by robots.txt
- The pages blocked by meta tag
- Non-canonical pages
- Pages with canonical tag
- Pagination pages
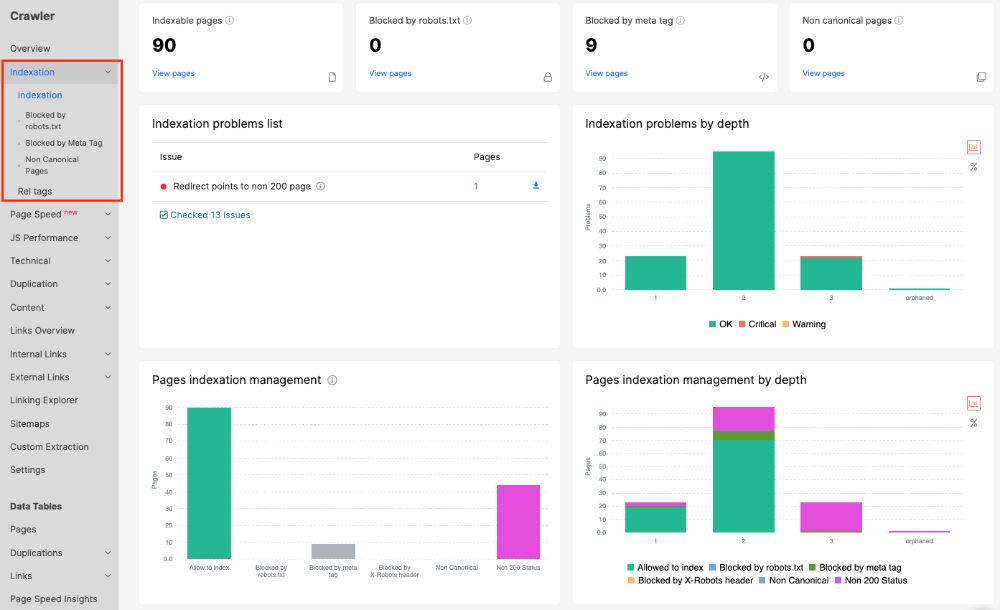
This is basically all you need to know to be able to correctly diagnose any indexation issues and come up with the right recommendations.
Page Speed
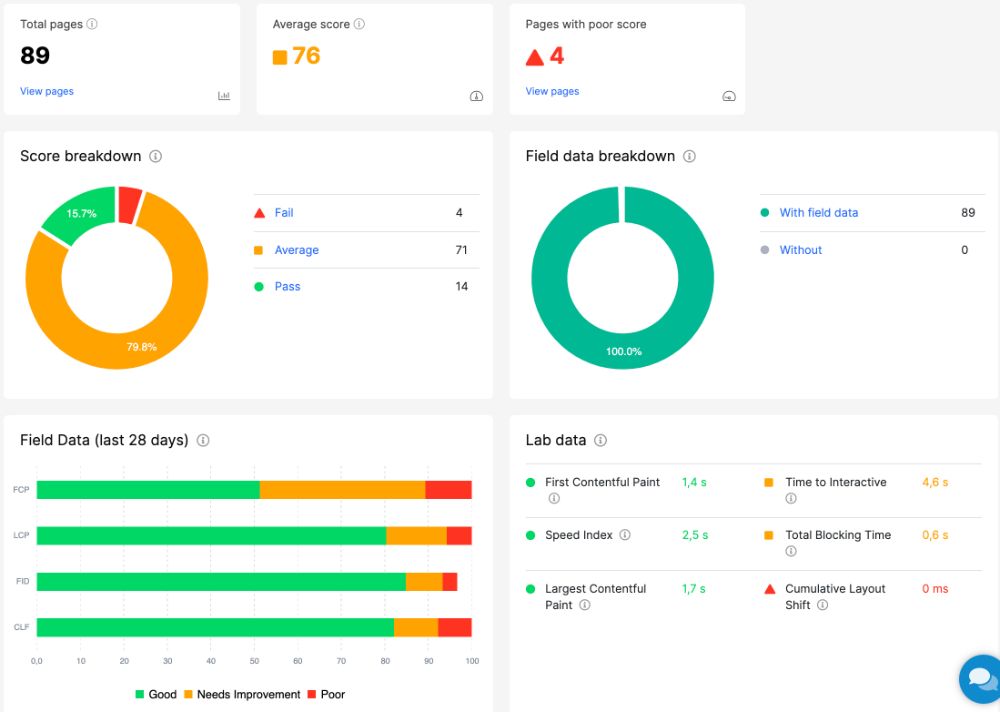
In the Page Speed section, you can take a look at how the site is doing in terms of the Google PageSpeed Insights scores.
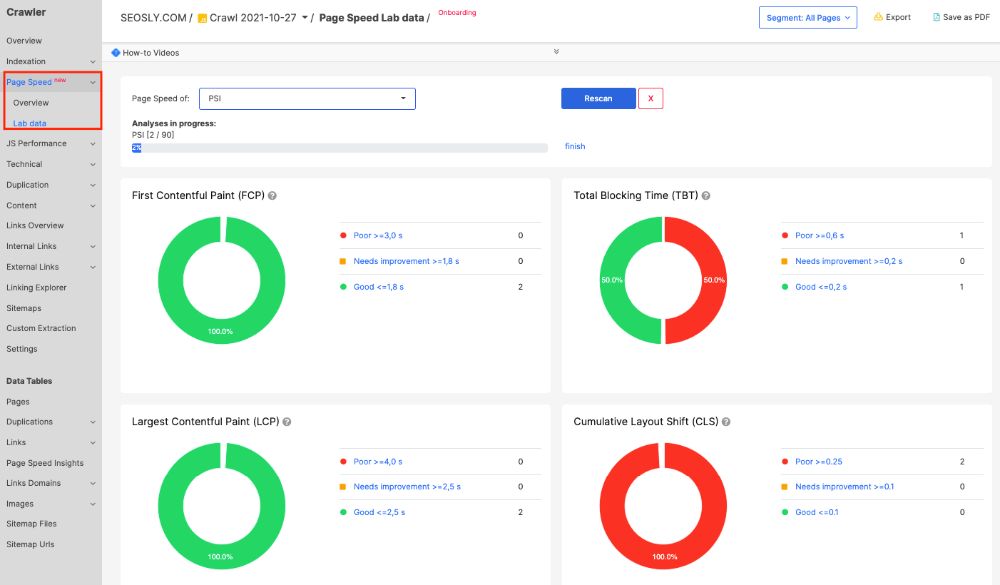
To get the PSI data, you need to add the PSI API in the JetOctopus crawler settings and manually start the PageSpeed Insights analysis.
The report lets you analyze all of the pages in terms of their PSI score instead of analyzing just one URL (which is the case if you manually check the speed with PSI).
JS Performance
JS Performance gives you the data regarding JavaScript execution such as First Paint, First Contentful Paint, Page load, and the time needed to complete all JS requests. You can also take a look at the JS errors.
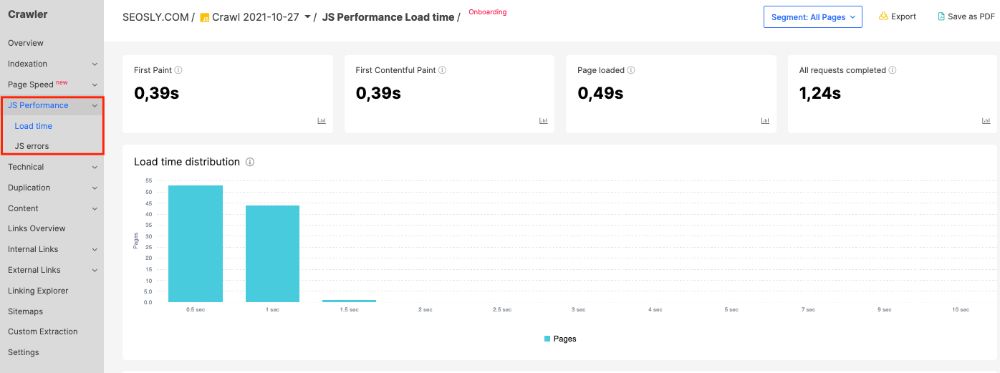
This report is especially useful if you want to analyze how JS impacts the site’s speed, overall performance, and indexability.
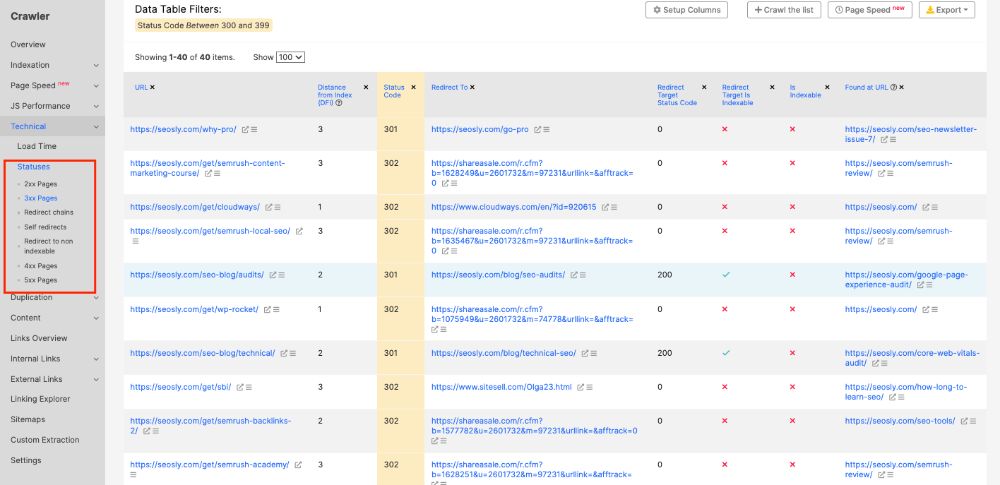
Technical
The Technical section lets you analyze in detail the load time of pages and the status codes.
- The Load Time report shows you the slow and the big pages. For example, I learned that the slowest page on my website is the technical SEO audit guide which is super long and has a lot of images.
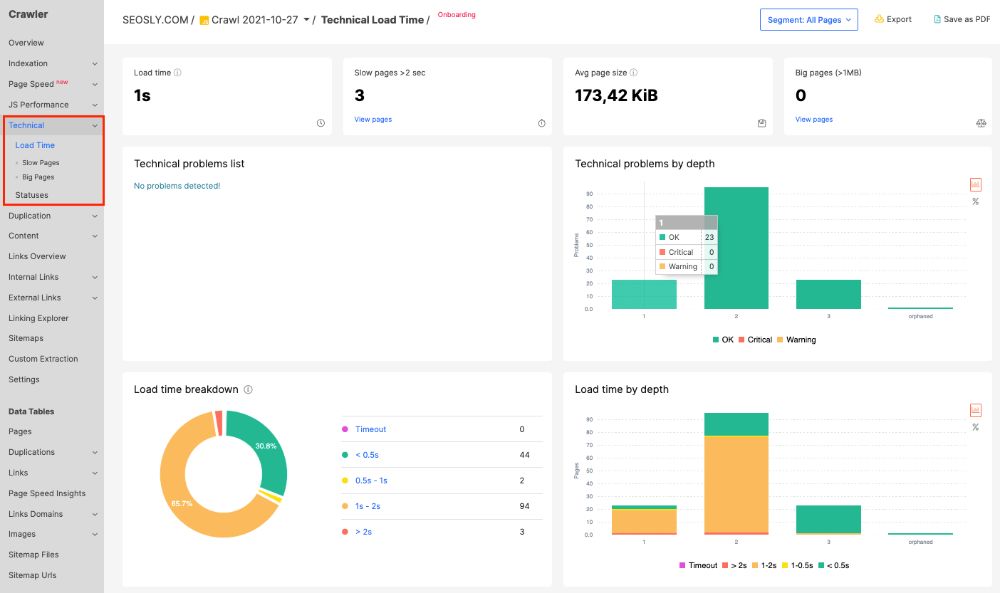
- The Statuses report groups pages by their status codes like 2xx, 3xx, redirect chains, 4xx, 5xx, and more.
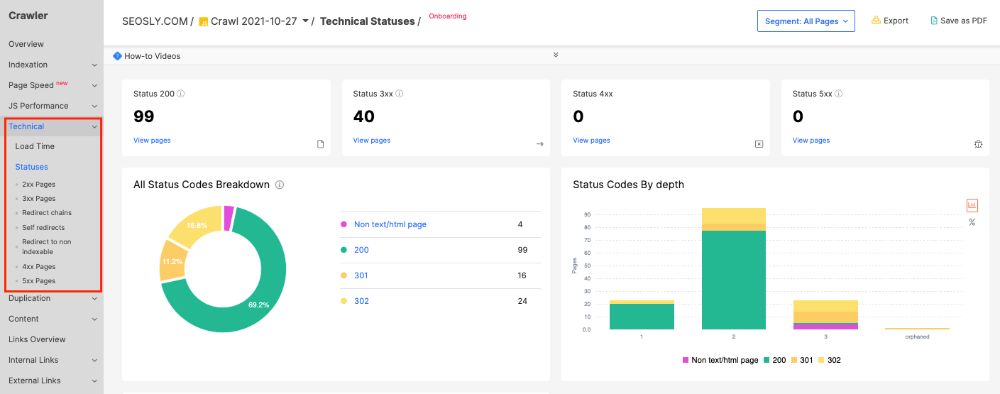
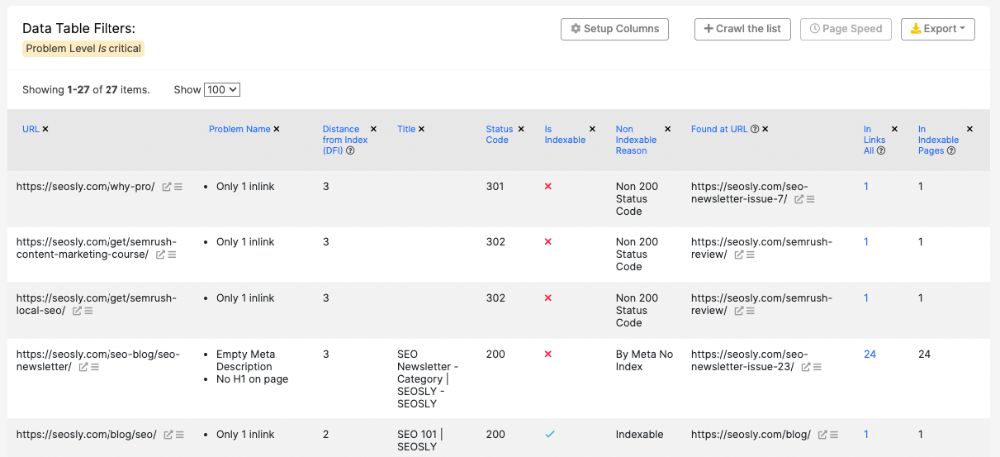
If you click on a specific section of the report, a specific data table filter will be applied to allow you to see the list of affected URLs.
Duplication
The Duplication section lets you check if the site has duplication issues. It shows the duplication within titles, meta descriptions, H1 tags, H1 tags, and content.
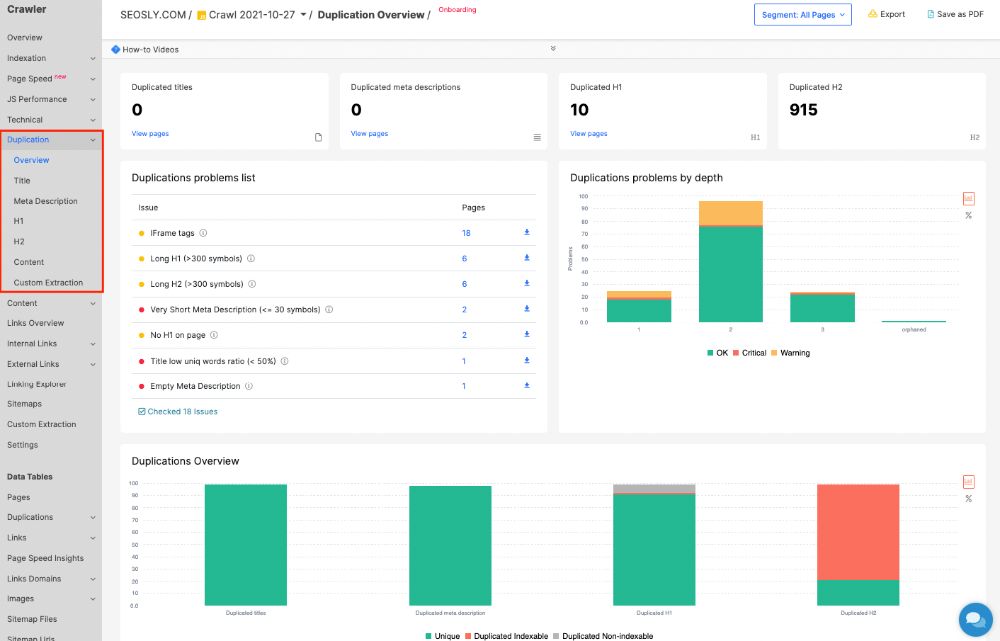
This report checks for the most common duplication forms and lets you decide within seconds if the site audited indeed has duplication issues and what pages are affected.
Content
The Content section gives you a wealth of data on the content of the site crawled.
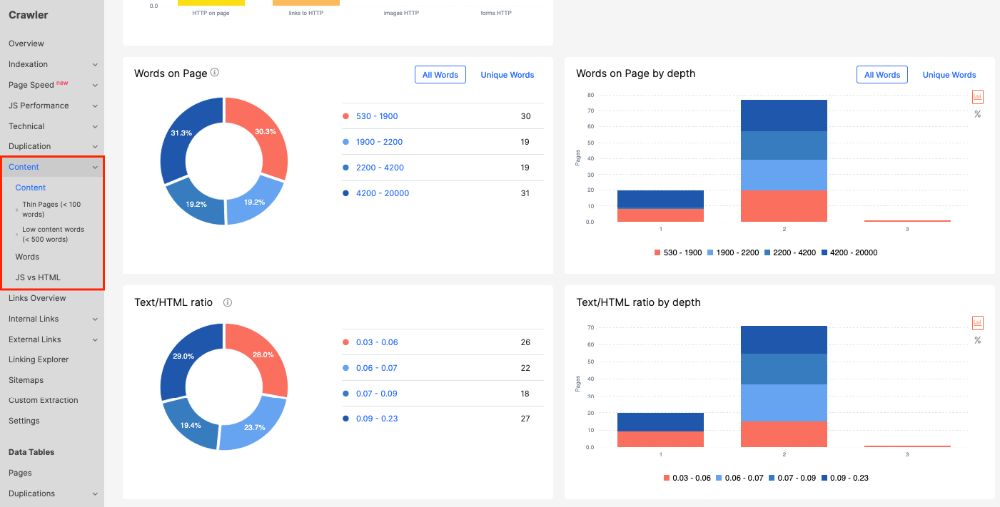
- The report shows you, among others, the average words on pages, average unique words on a page, average images on the a page, HTTP resources, thin pages, low content pages, and more.
- You can also analyze the number of words in specific site elements, such as titles, H1 tags, H2 tags, etc.
- The JS vs HTML report shows you if after the execution of JavaScript there are changes in indexability, titles, or meta descriptions of pages.
Links Overview
The Links Overview gives you a ton of useful and actionable data regarding both internal and external linking of the site.
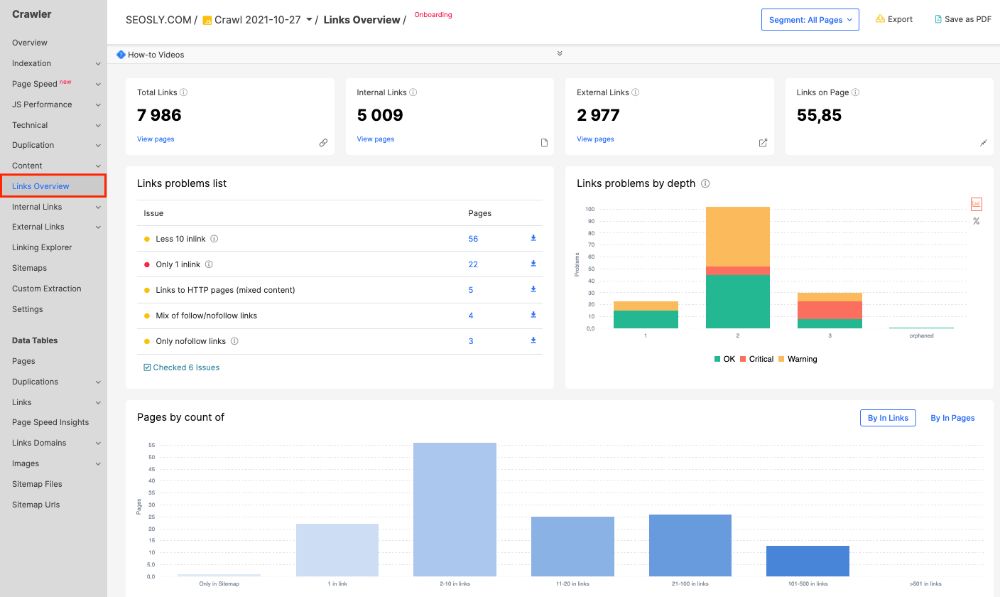
You will get information about the total number of links, the number of internal/external links, the average number of links on a page, and more.
This report is extremely useful if you are auditing the linking structure of the site.
Internal Links
The Internal Links report lets you analyze internal links only and get data on the number of internal links, image links, no-follow links, or links to non-indexable pages.
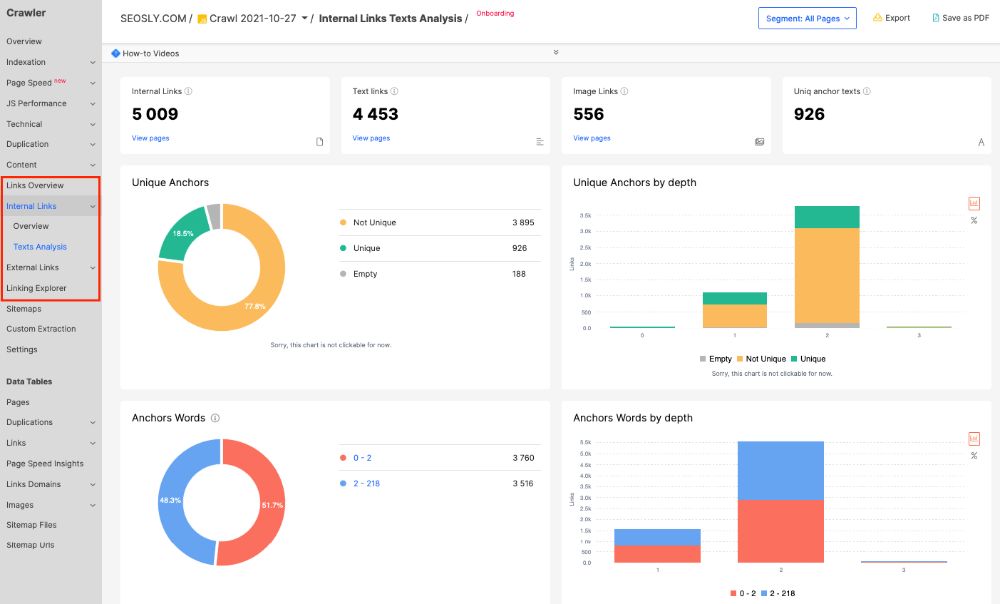
The Internal Links report contains all the data you need to run a quality internal linking audit of the site. In addition, you can also analyze the anchor text of internal links.
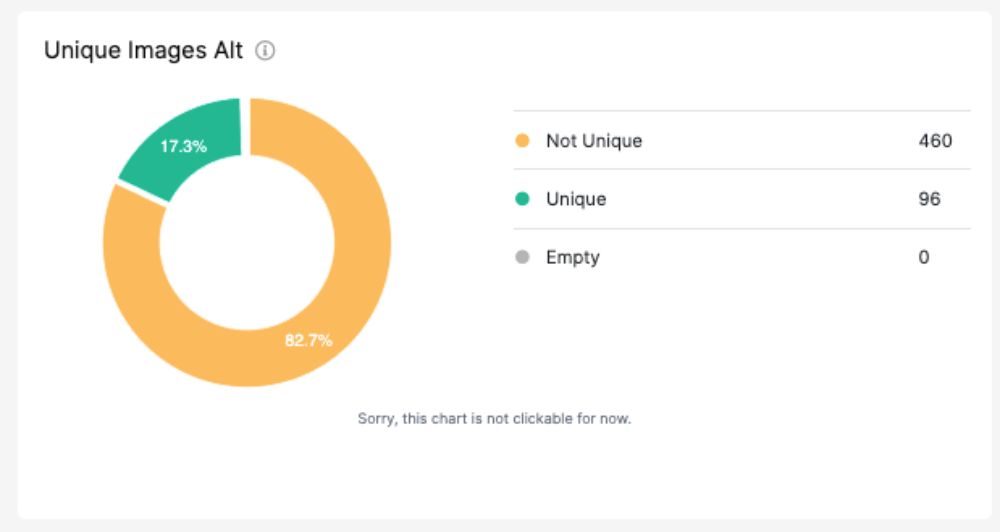
For example, I especially like the data on Unique Images Alt which can help identify if some keyword stuffing is taking place in ALTs.
The report will also show you the top anchor texts and the top image ALT text, which is super useful.
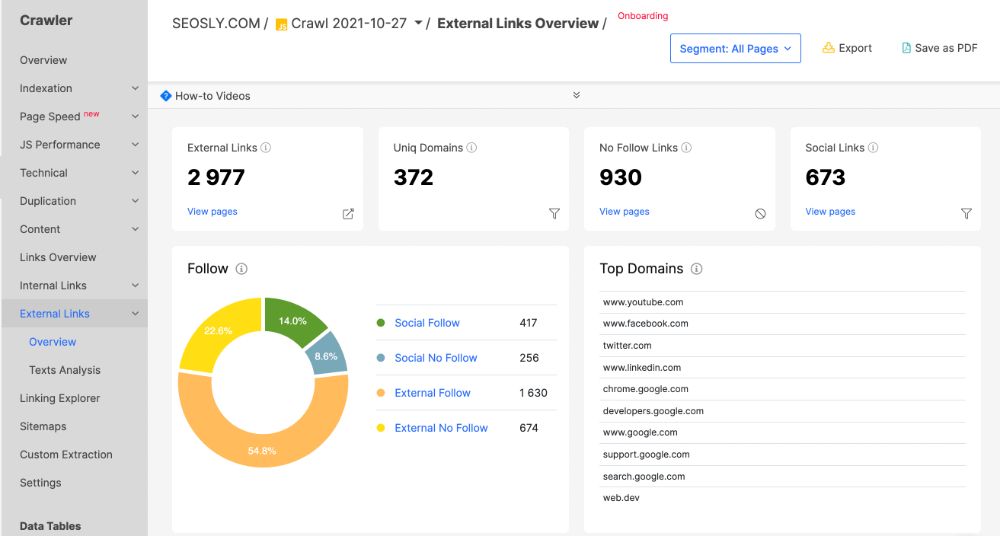
External Links
The External Links report provides valuable information on how the site links to other websites on the Internet.
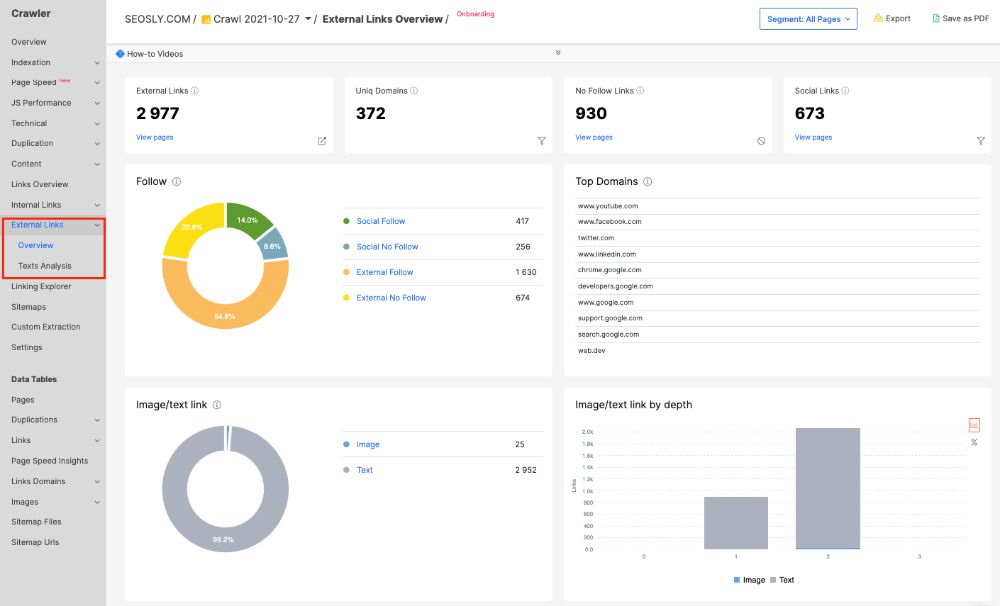
The report gives you information on the total number of external links, unique domains, no-follow links, social links, and more. You will also learn about the top external domains, the image/text link ratio, and the anchor text used for external links.
Linking Explorer
The Linking Explorer lets you analyze in detail how a specific URL is linked within the structure of the site. This is really useful!
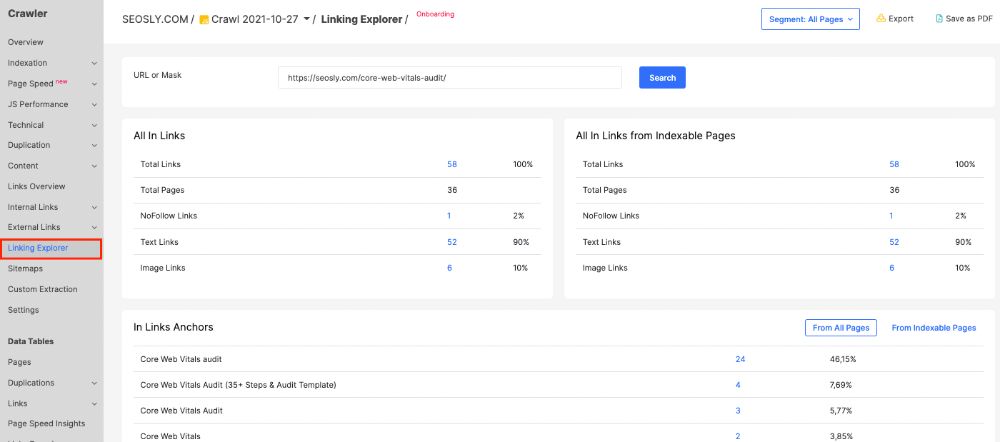
You will get information about the total number of links a given URL has, no-follow links, text links, image links, anchor texts, and more.
Sitemaps
The Sitemaps section lets you analyze the content of sitemaps and whether they contain the correct URL. The report will highlight orphan pages and pages returning non-200 status codes.
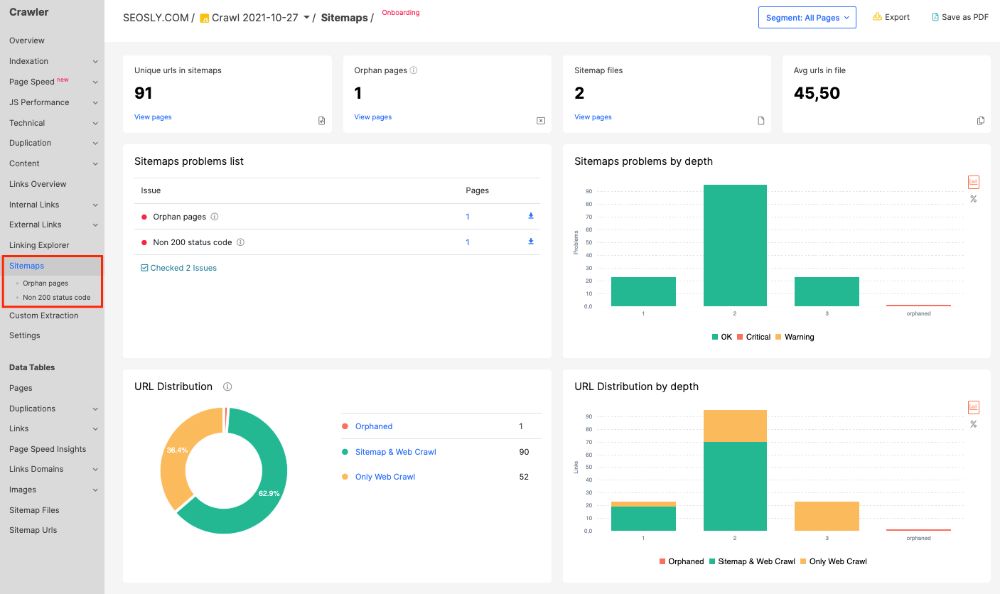
In the case of huge websites (with hundreds of thousands of URLs), it is especially useful to check if sitemaps contain only the correct 200 URLs.
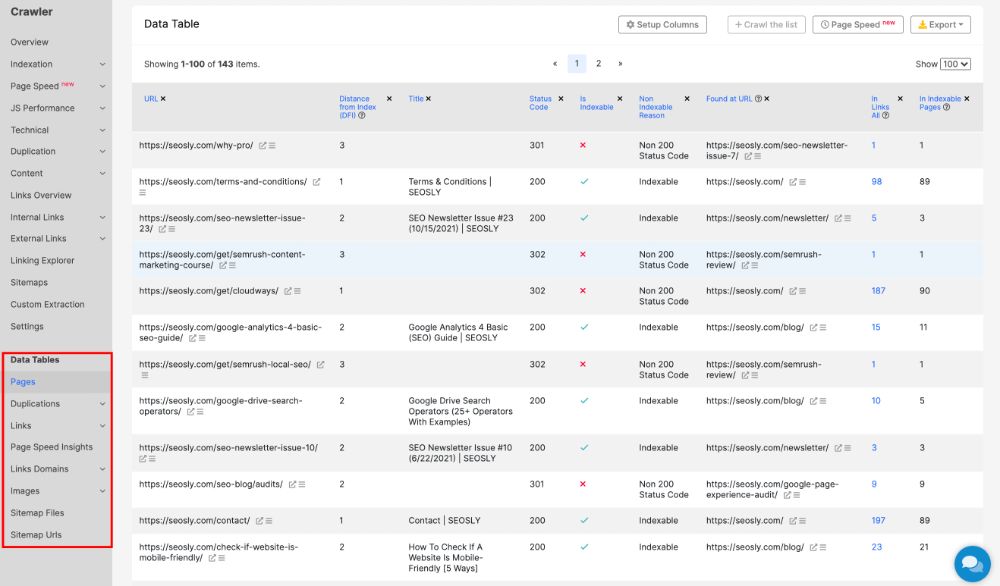
Data Tables
The Data Tables section is a set of predefined filters that let you analyze specific groups of pages or specific pages with specific problems.
The predefined filters include:
- Pages
- Duplications (titles, meta descriptions, H1)
- Links (to 302 redirects, to 4xx pages, to 5xx pages, to non-200 status code pages, to non-indexable pages)
- PageSpeed Insights
- Links Domains (external domains, external domains dofollow, internal domains)
- Images (external images, internal images, images as links, lazy load images)
- Sitemap files
- Sitemap URLs
Other features of JetOctopus
In this guide, I am focusing on the SEO audit side of the JetOctopus tool. However, it’s worth noting that the tool offers other super useful features, such as:
- Alerts based on GSC data and log data
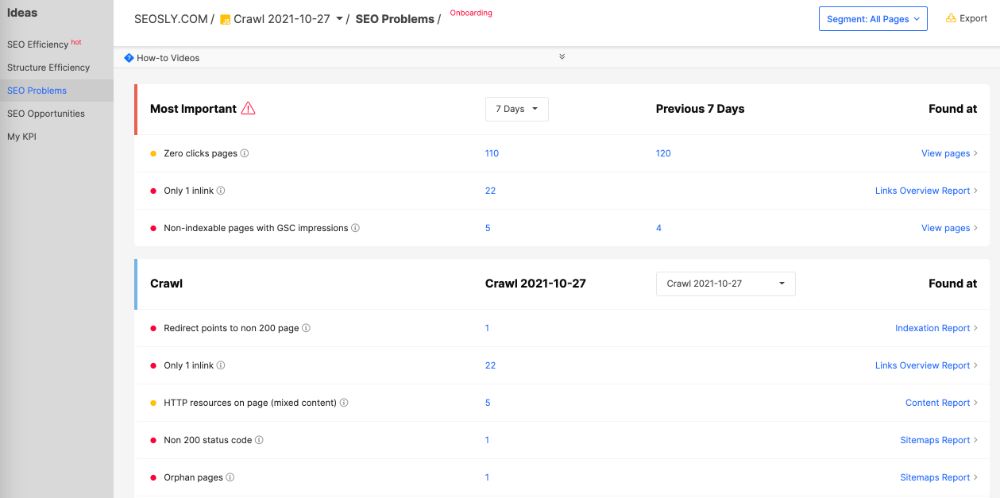
- Ideas showing you the main SEO problems, opportunities, structure efficiency, SEO efficiency, and more. This is especially useful if you have your site added as a project and regularly crawl it.
- The possibility to compare crawls
- A log analyzer that provides you with tons of useful information (I will create a separate guide on the JetOctopus log analyzer)
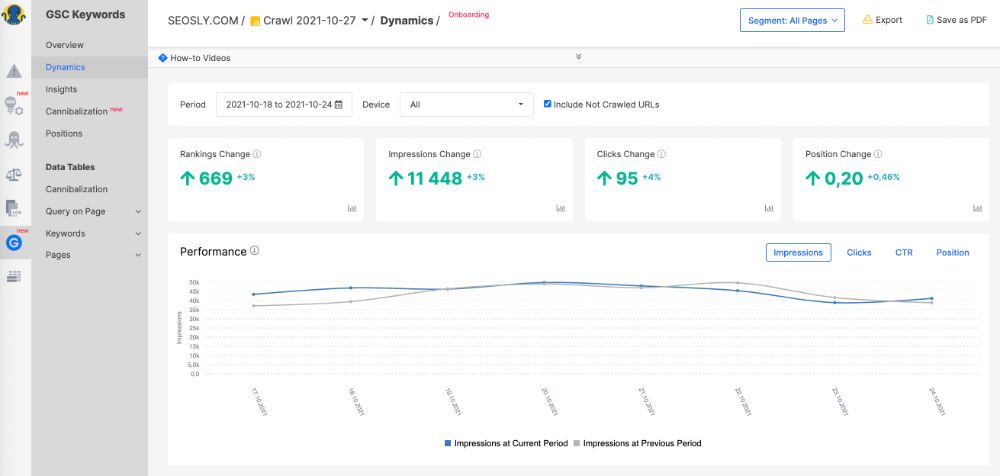
- Google Search Console keyword data visualization that lets you make the most sense from the GSC data.
What I especially like about JetOctopus
I have experience using different types of crawlers and SEO auditing tools but this one is really one of my favorites and I am definitely adding it to my essential SEO auditing toolkit that I use every time I audit a site.
What I like about JetOctopus the most is that it allows you to perform very thorough analyses of the internal and external linking structure of your website.
With the help of Structure Efficiency (Ideas > Structure Efficiency), you can analyze how internal linking structure correlates with the GSC data of the URLs at specific directory levels.
You can see, for example, the number of impressions, clicks, and avg. position a given URL has together with data on the average number of links in and referring indexable pages. Super useful.

Moreover, the crawl reports, such as Links Overview, Internal Links, and External Links provide a wealth of information about the linking structure of the site.
For example, you can easily see – within 1-2 clicks – the total number of links, internal links, external links, image links, no-follow links, social links, links to non-indexable pages, links to HTTP pages, links that open in a new window, and more. That’s a ton of data!
JetOctopus also very nicely visualizes the data from the PageSpeed Insights and lets you instantly see the average score of all pages, the pages with the poor/average/good score, the field data, and the lab data summary. I like it a ton!
Extra tips on auditing a site with JetOctopus or any other SEO crawling tool
SEO crawling tools do the dirty work of scanning and extracting data for you. Your task as an SEO is to make sense of this information and act according to the plan:
- You should always have the list or template containing the SEO elements you want to analyze on the website. You can use my technical SEO audit guide to help you come up with such a list.
- You should use the SEO crawling tool to help you go through that list, not vice versa. It shouldn’t be the tool that is telling you what SEO issues the site has. It should be you using the tool to check if a specific issue exists. Tools often mark a lot of things as high-priority or critical issues while in fact, they are not. Your task is to overlay the data extracted by the tool with your SEO experience.
- It’s always a good idea to use multiple SEO crawlers to audit a site. Thanks to that you will always have a bigger picture of the site. My favorite combo is to use Screaming Frog, Sitebulb, JetOctopus, and Google Search Console.
Final words of wisdom
As you can see, JetOctopus is definitely the SEO tool you don’t want to miss. Thanks to its super-fast crawling speed, it gives you almost instant access to valuable and actionable data about the site without killing your computer (as this is a cloud-based crawler). I definitely recommend you use JetOctopus for your next technical SEO audit!
Here are other SEO audit guides you may like:
- A Basic Guide On How To Analyze Log Files With JetOctopus
- 65+ SEO Audit Tools
- How To Do An SEO Audit (190+ Steps)
- How Long Does A Technical SEO Audit Take?
- How To Audit A Site With Ahrefs Site Audit
- How To Perform An SEO Audit Using Google Search Console
- Google Product Reviews Update & E-A-T Audit
- How To Audit A Site With Sitebulb
Thanks for this information you sharing with us
I will be checking out this site JetOctopus. I am always looking for the next great Seo tool.