Here is the complete guide to the new Google Search Console crawl stats report. The guide is based on the documentation from Google and my own analysis of the report.
The crawl stats report is here to help you better understand how Google crawls your website by providing detailed information on the requests made to your website.
Here I am diving deep into the new Google Search Console crawl stats report making it clear to all of you (both SEOs and non-SEOs) what the crawl stats report is, what it is not, how to use it, and – importantly – how not to use it.
What is the Google Search Console crawl stats report?
The Google Search Console crawl stats report is a feature available in GSC that allows you to dig deeper into how Google crawls your website.
The new features in the updated crawl stats report include, among others, grouping requests (by response code, by file type, by crawl purpose, and by Googlebot type), URL examples for each group, statistics about the hosts, and more.
These new features may sound rather obvious and straightforward but in reality, they are not. I noticed that some people:
- are having trouble fully understanding the new crawl stats report,
- are not sure how to use it to learn about the things that actually move the needle for their website,
- and – as a result – do not make the most of the data provided by the report.
Let’s bust all the myths that have already been created around the new crawl stats report.
This is what the crawl stats report is:
- It is a feature available in Google Search Console. The report is available under Settings > Crawling > Crawl stats > OPEN REPORT.

- The report contains the statistics about how Googlebot has been crawling your website over the last 90 days.
- The crawl stats report is for domain-level properties only. This means that you need to have either a Domain property or a URL-prefix property at the domain level in Google Search Console. More on different property types can be found in this Search Console Help article.
- The crawl stats report is intended for websites that have more than one thousand pages. Google explicitly says that you do not need so much crawling detail for smaller websites.
My website (seosly.com) is smaller than 1000 web pages but I am using it as an example for the purposes of this guide. I am curious if I can still learn some important things from the crawl stats report even if I have a smaller website.
The new GSC crawl stats report will provide you with the data on:
- The total number of crawl requests (overall and divided into specific groups)
- The total download size (kB) (overall and divided into specific groups.
- Average response time (ms) (overall and divided into specific groups)

- Detailed information on hosts (statuses, response codes, etc.)

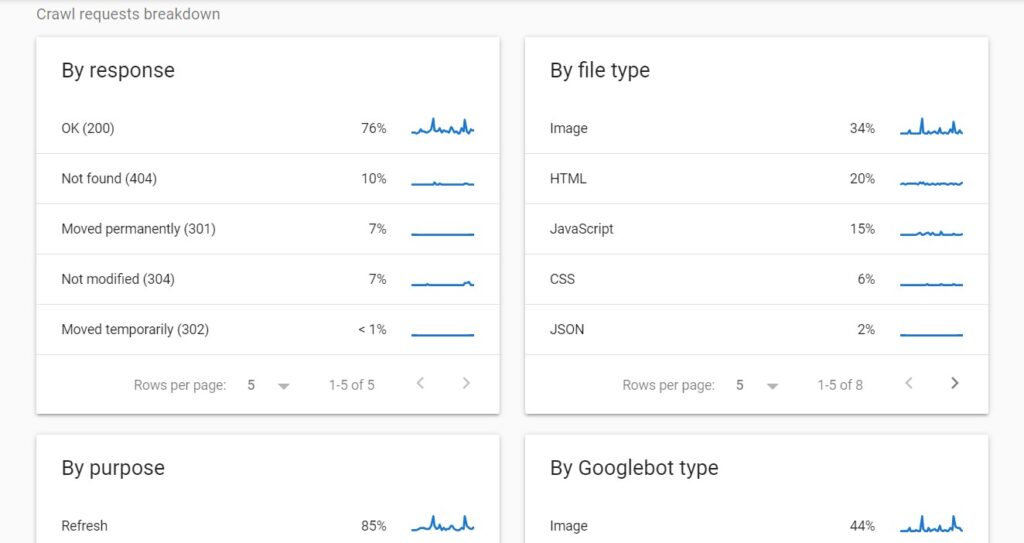
- Crawl data grouped by response code, file type, crawl purpose, and Googlebot type (each group also displays its specific statistics about the total number of requests, total download size, and average response time)
- Example URLs for each type of stats data
It seems we are getting a lot of useful and actionable data about Google crawling our site! Before I tell you how to use these data, I want to explain how the crawl stats report actually works and what it is NOT.
Here is the Google documentation of the crawl stats report and a blog post about the new features of the crawl stats report.
How does the crawl stats report work?
Google did a great job explaining how the crawl stats report works and how it collects data (statistics). Here is what you need to know.
⚡ The Google Page Experience is becoming a THING in SEO. Do not miss my Google page experience audit and my Core Web Vitals audit.
The report shows most (but not all) crawl requests
- The crawl stats report contains the data on most crawl requests, but not all crawl requests.
- This means that there can be a discrepancy between what you see in server logs vs in what is in the crawl stats report.
The report shows example URLs
When you click on any specific crawl request type in any group (for example, OK (200) under By response), you will see the list of example URLs.
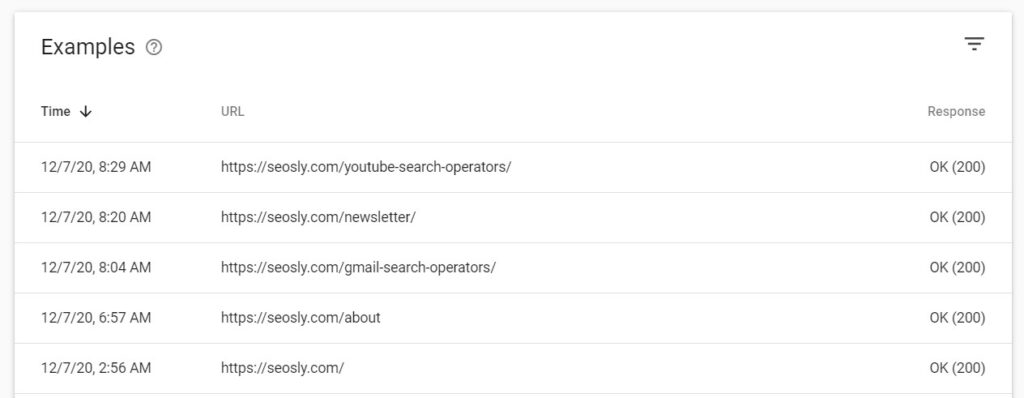
- These are example URLs for a given request type, which means these are not all the queries matching a given request. This is a sample.
- In the case of my website, there are 346 URLs under 200 (OK). This is, of course, not the entire list of URLs returning 200 for my website. This is the list of sample URLs Google chose to share with me.
⚡ Check my on-page SEO checklist with 70+ on-page SEO elements and a total of 500+ pro SEO tips included.
The report shows the actual URLs requested
The example URLs provided in the reports are the actual URLs that Google requested. This means that the report can indicate both:
- a canonical URL if this was the URL requested
- a canonicalized URL if this URL was requested
Canonicalized URLs are not folded under a canonical URL. They are reported separately.

In the picture above you can see canonicalized URLs reported separately. The canonical URL of my website is https://seosly.com. The examples above are canonicalized and redirected to the canonical URL.
The same applies to redirects in the case of which the crawl stats report will show:
- a target URL if the target URL of a redirect was requested
- each URL in the redirect chain (with a 301 or 302 redirect in place)
And here are the example requests to URLs that are redirected (with a 301 redirect).
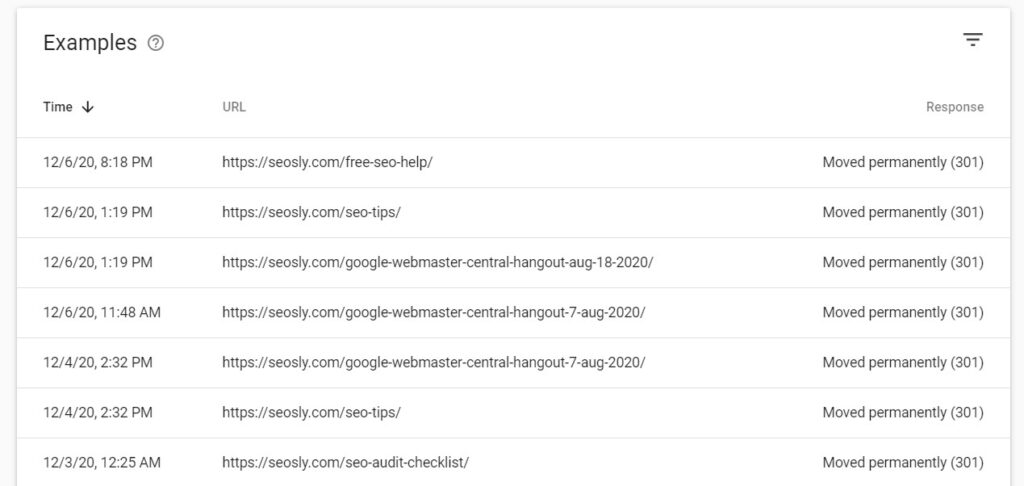
In practice, this means there may be multiple requests that actually relate to one canonical or redirected URL.
The report will not show requests for external resources
The data shown in the crawl stats report relates to the currently selected domain only.

- If your website contains some external resources, you obviously won’t see crawl stats about those.
- The same applies to sibling domains like de.domain.com. To see crawl data from those, you need to switch to a specific property in GSC.
The report will show data for subdomains
A parent domain will show crawl requests for child domains.
- If you have a domain property, you will see the data for child domains (subdomains).
- In the case of my website, I have a domain property so I can see the stats for both the www and non-www requests for my domain. I don’t have any subdomains so I don’t see them here.

The report will show data for both HTTP and HTTPS protocols
- If you have a domain property or a URL-prefix property, the crawl stats report will include data for both HTTP and HTTPS URLs.
- However, in the case of a URL-prefix property, the example URLs will show only the protocol of the property (either HTTP or HTTPS).
What is the crawl stats report NOT?
And here is what the crawls stats report is NOT and what it should NOT be used for.
The crawl stats report is not a replacement for a server log analysis
The crawl stats report is not here to replace (especially 1:1) a server log analysis. You can use it instead but do not expect that server logs will show you exactly what the crawl stats report shows.
❗ Server logs will show you all the requests made by all the crawlers while the Google Search Console crawl stats report will show you the selected sample requests made by Google.
The crawl stats report is not a replacement for a website crawl for auditing purposes
Some of the data you will find in the crawl stats report may look similar to what Screaming Frog or other website crawlers show (like response codes, server issues, and so forth). This is by no means the whole picture of the state of the website.
❗ If you are doing an SEO audit, you need to crawl the whole website. The Google Search Console crawl stats may be a nice addition to your audit.
⚡ If you are auditing a website, you may want to check my SEO audit guide.
The crawl stats report is not the only tool you should use to detect issues in a website
The crawl stats report will indicate if there are issues on your websites, such as if Googlebot came across a 404 web page or a server error. Note that the stats report will give you the data only about the resources Google chose to crawl. Again, this is not the entire picture.
❗ To detect all the possible issues in a website, you need to crawl it with a specialized tool. And, in addition to that, use a bunch of other SEO tools.
How to use the crawl stats report: the DO’s
And – finally – here are a few tips on how to use the new crawl stats report to actually learn new, useful and actionable things about your website.
1. Use the report to get a glimpse of how Googlebot crawls your website
Once you open the crawl stats report, you will see the chart showing the crawl stats divided into three groups.
Total crawl requests
This shows you the total number of requests made to a website, including both successful and unsuccessful requests.
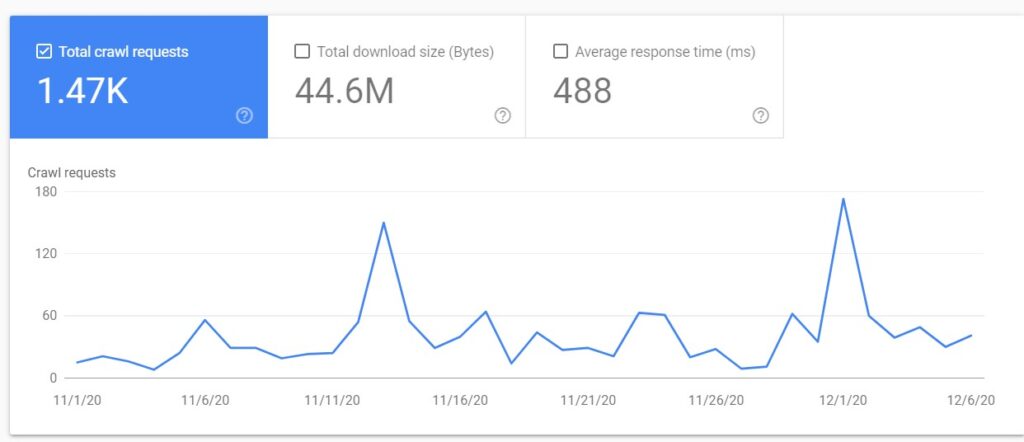
Duplicate requests for the same URLs are treated as separate requests. Unsuccessful requests may include:
- Requests that were not completed due to the availability problems with the robots.txt file (i.e. robots.txt was returning connection issue responses (HTTP 429/5XX)
- Requests for the resources that had DNS resolution and server connectivity issues.
- Requests that failed because of redirect errors (like redirect loops)
Total download size (kB)
This is the total size of files and resources downloaded during crawling over the last 90 days.
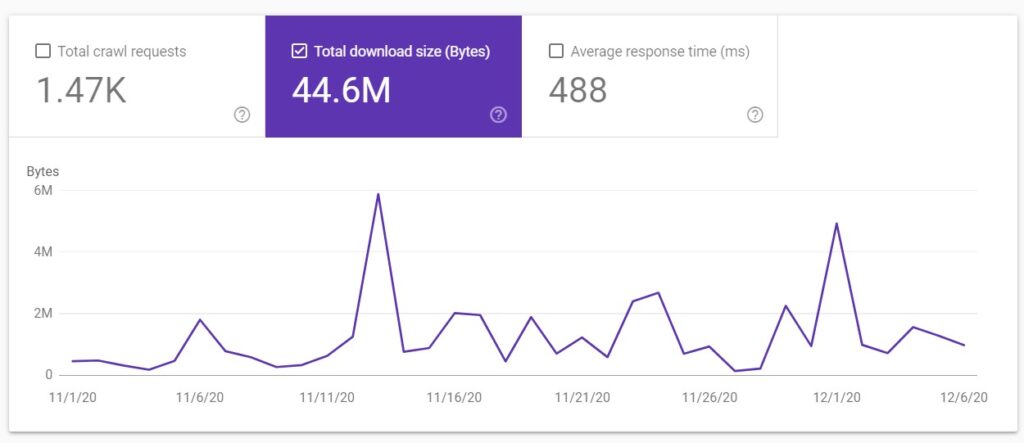
Resources that are already cached are not counted against this number. This size includes HTML, images, scripts, and CSS.
Average response time (ms)
It is important to note that average response time shows the time that a crawl request needed to retrieve the content of a web page.
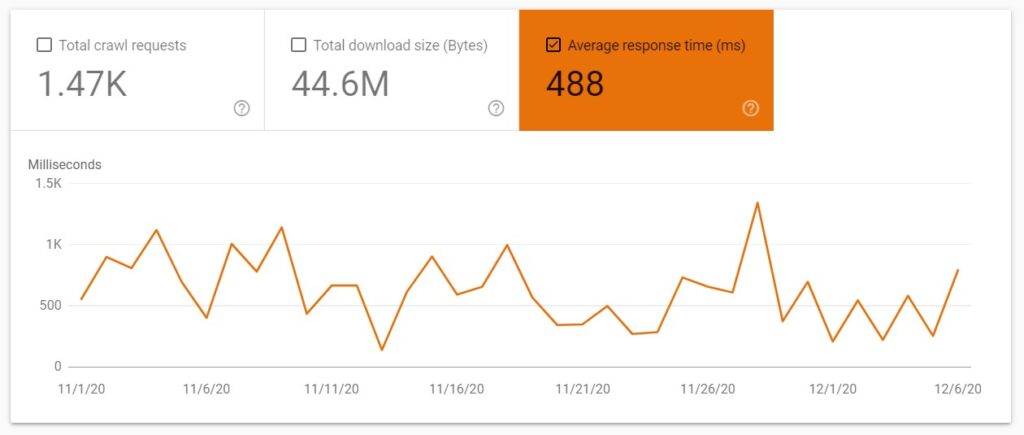
This does not include the time needed for retrieving page resources (scripts, images, etc.), or rendering time.
You can display the date for just one of these metrics or all of them. If you choose to display more than one, the charts will nicely populate one over another.
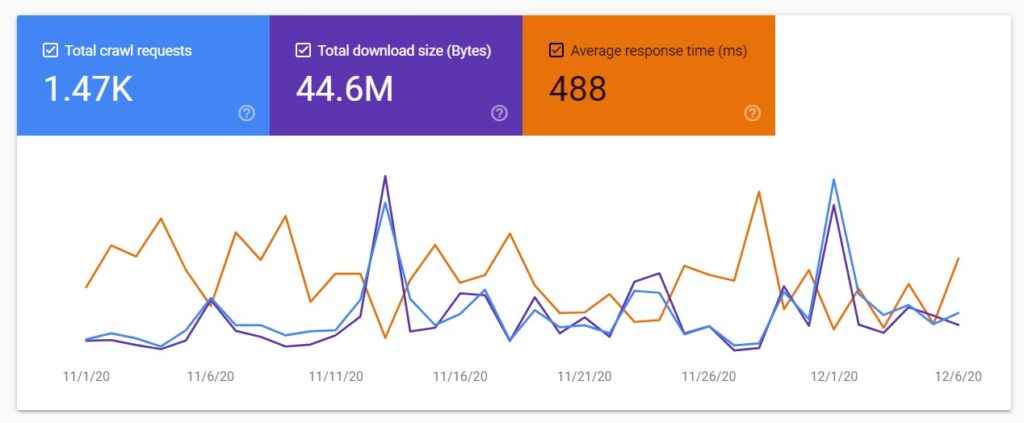
???? Google says it is a 90-day chart but I see the data from a little over a month (the data starts on November 1). I guess the period will be extended to 90 days when 90 days will have passed since November 1.
2. Use the report to check the health of your hosts
The section Hosts is probably the most important section when it comes to analyzing the health of your host and learning if Google is having problems crawling your website.
Once you open the crawl stats report for your website, you will see the section Hosts right under the chart showing total crawl requests, total download size, and average response time.
If you are using a domain property, you will also see all child domains listed here with information about their status. I am using a domain property, so I can see both seosly.com and www.seosly.com under Hosts.

- To view the details for one specific (child or parent) domain, simply click on it. This section can display the statistics for up to 20 child domains.

- Note that the parent domain will display the crawl statistics for both the parent domain and all child domains.
This means that from the main view of my domain property all the statistics I see are related to all the hosts of seosly.com. If I click on www.seosly.com, then I will see the stats for www.seosly.com only.

There are the 3 main areas Google assesses your hosts when it comes to its availability to crawlers. They include robots.txt fetch, DNS resolution, and server connectivity.
What does Google take into account when assessing the availability of the host?
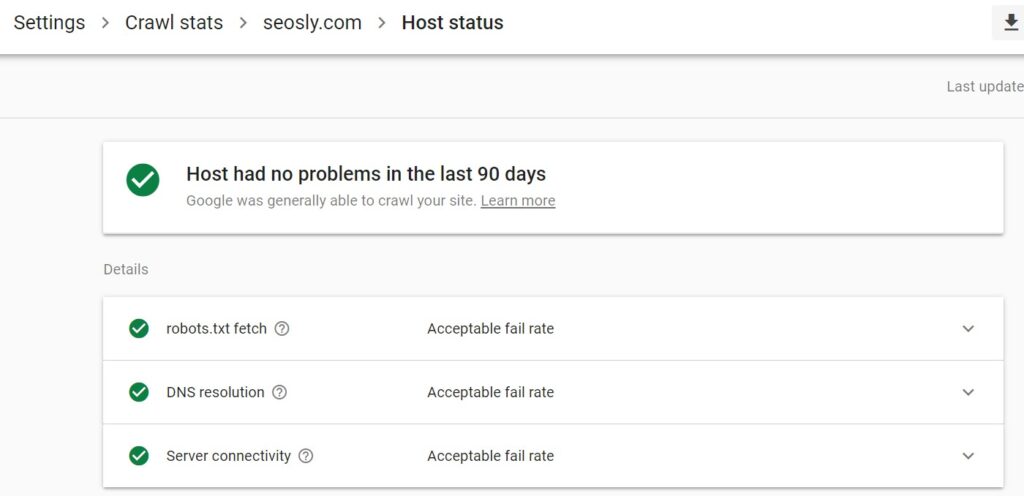
To learn the details about each, simply click on the host you want to investigate (in my case that would be seosly.com) and then click on Host status.
You will now see the details on each of the 3 areas. Ideally, you should see green checks informing about the acceptable fail rate everywhere (like on the picture above).
Okay, but what do these three, let’s call them criteria, really assess?
robots.txt fetch
The robots.txt fetch contains details on Google requesting the robots.txt file. If there are any issues with the robots.txt fetch, then the graph will show the fail rate (the percentage of failed requests).

Google will crawl the website only if it receives a successful response from robots.txt. There are only two possible successful responses:
- Status 200 (OK)
- Status 403/404/410 (the file is not found or does not exist).
Note that Google considers it an availability issue if the number of the robots.txt fetch errors exceeds a specific baseline number per day.
PRO TIP: As long as the robots.txt returns status 200, Google will always consider it a successful response even if the robots.txt is empty or invalid (has syntax errors).
PRO TIP 2: The robots.txt is not required for every website. However, if you want Google to treat the lack of the robots.txt file as a successful response, you need to make sure it returns status 403, 404, or 410.
If there are issues with the robots.txt fetching, your next step should be to take a deeper look at them. You can learn more about robots.txt in this Google article. You can also use the robots.txt tester.
- If you are unsure how to find robots.txt in your WordPress website and how to modify, check my article on how to access robots.txt in WordPress.
- You can also learn how to verify Google Search Console in WordPress.
DNS resolution
This one is pretty self-explanatory. Under DNS resolution, you will see whether there have been any DNS errors when Google was crawling your website. If there are any issues, you will see their percentage (the percentage of requests that had DNS resolution issues out of all the requests made to a website).
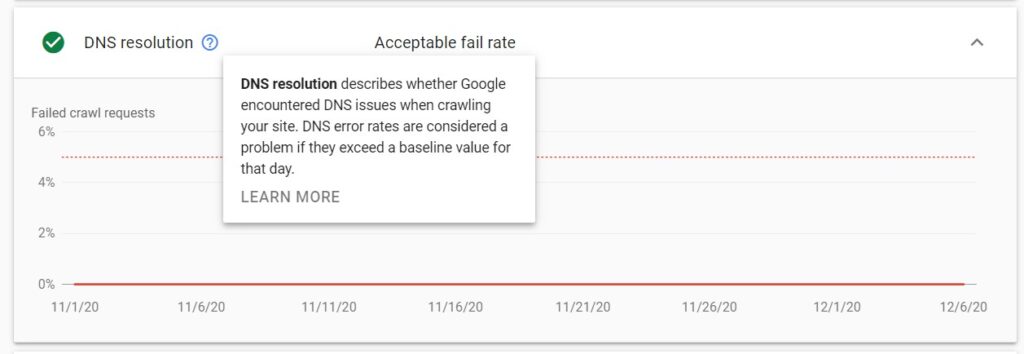
The DNS resolution issues occur when:
- The DNS server is not recognizing the hostname
- The DNS server is not responding
Just like with the robots.txt fetch, the DNS resolution error rate is considered an issue once a specified baseline value per day is exceeded.
The course of action is to usually contact the registrar and check if your website is set up correctly.
Server connectivity
This one is also pretty straightforward. Server connectivity simply provides information about the percentage of failed crawl requests caused by server connectivity issues.
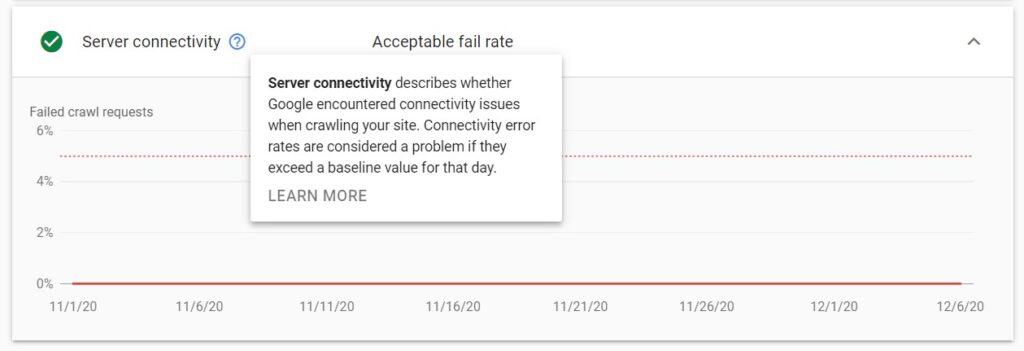
These issues may include:
- The server being unresponsive
- The server not providing a full response
Just like with the robots.txt fetch and DNS resolution, server connectivity errors are regarded as a problem once they exceed a certain baseline for the day.
How does Google measure and assess the robots.txt fetch, DNS resolution, and server connectivity?
There are 3 possible statuses indicating the health of your hosts. Here is what they mean and what criteria Google uses when assessing host issues:
- Green check

This host status is great news for your website. It means Google has had no problems crawling your website over the last 90 days.
This does not require any action from your side.
- White check

This host status means that there has been at least one serious crawling issue in the past 90 days but not over the last 7 days. It is possible that the issue has been resolved by now or that it was a temporary or one-time problem.
- Red exclamation mark

The red status is probably bad news for a website. It means that there has been at least one serious crawling issue over the last 7 days. The issue is quite fresh, so you probably want to examine it as quickly as possible.
What to do with host status statistics?
Unless you have green checks in all free areas, your immediate analysis (and possible action) is usually required.
Your task here is to:
- check the details to see if the issues were related to robots.txt fetch, DNS resolution, or server connectivity.
- check the response codes of failed crawl requests
- decide if this was a major or minor issue
- investigate further if needed
3. Use the report to analyze crawl responses
This part of the new crawl stats report is also very important as it gives you the most powerful information which you can immediately act upon.
You can see the summary of crawl responses (the table header By response) right under the table showing the statistics about the hosts.
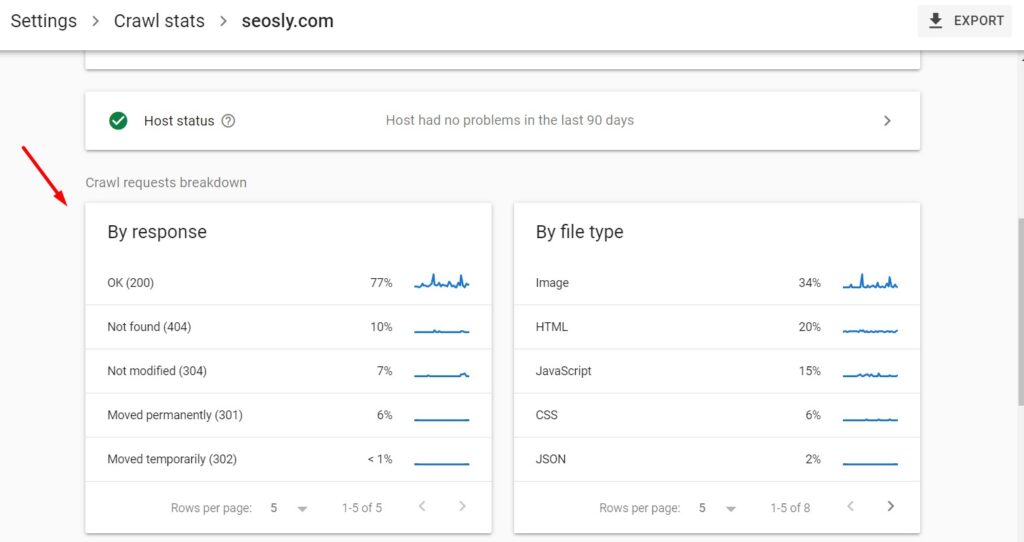
Crawl responses contain the statistics about the responses received by Google when crawling a website. The requests are grouped by the response type (not the URL). Next to each response, you can see the percentage (among all the responses Google received from a website).
In the case of my website, I can see that 77% of all the responses Google received are OK (200).
PRO TIP: These data relate to all the requests made to a website. This also includes multiple requests for the same URL.
To see the URLs that returned a given response type, simply click on the response type. Here is the list of the 200 (OK) responses for my website:
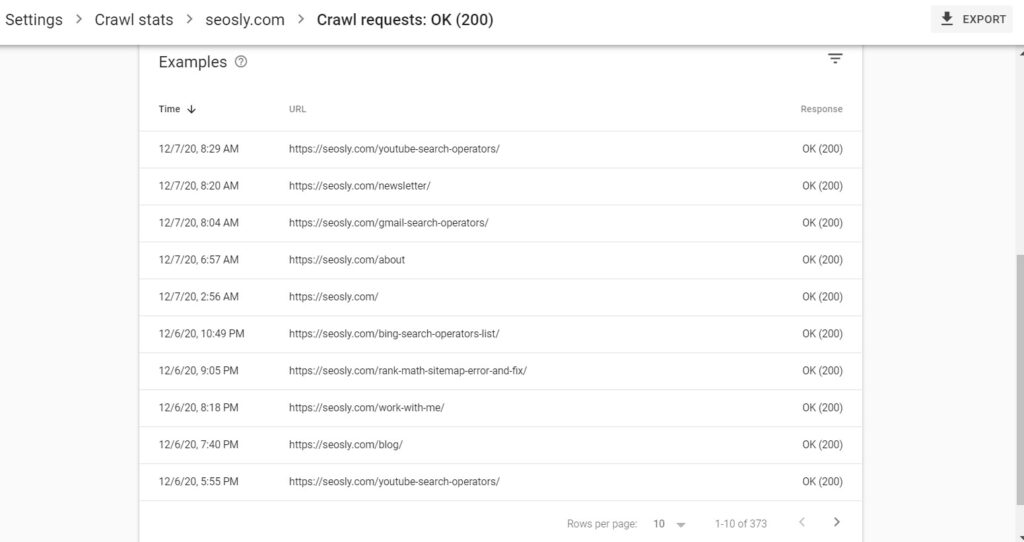
Types of responses by Google
Google divides the types of responses into good, possibly good, and bad. I really like this division! Here is its summary together with my own insights.
Good crawl responses
Good crawl responses are the ones that don’t cause any crawling issues and are completely clear to Google. These include:
- 200 (OK) ✔️
- 301 (moved permanently) ✔️
- 302 (moved temporarily) ✔️
- 300 (moved) ✔️
- 304 (not modified) ✔️
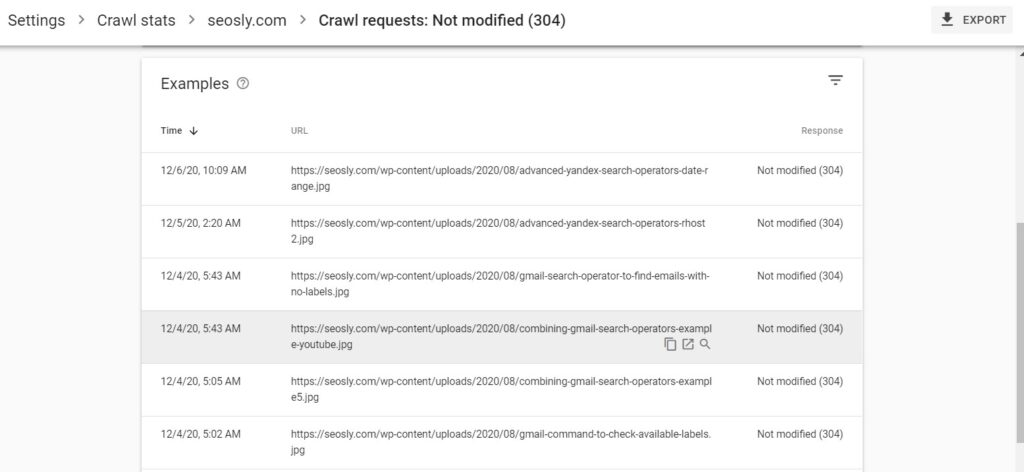
Possibly good crawl responses
The following crawl responses can be good assuming that they do what you actually want and intend. Possibly good crawl responses include:
- Blocked by robots.txt ✅
- 404 (not found) ✅

Google in its documentation does not mention the 410 (gone) response code. I assume this is also a good crawl response as long as it is used in line with its purpose which is to indicate that the resource requested has been permanently deleted.
Bad crawl responses
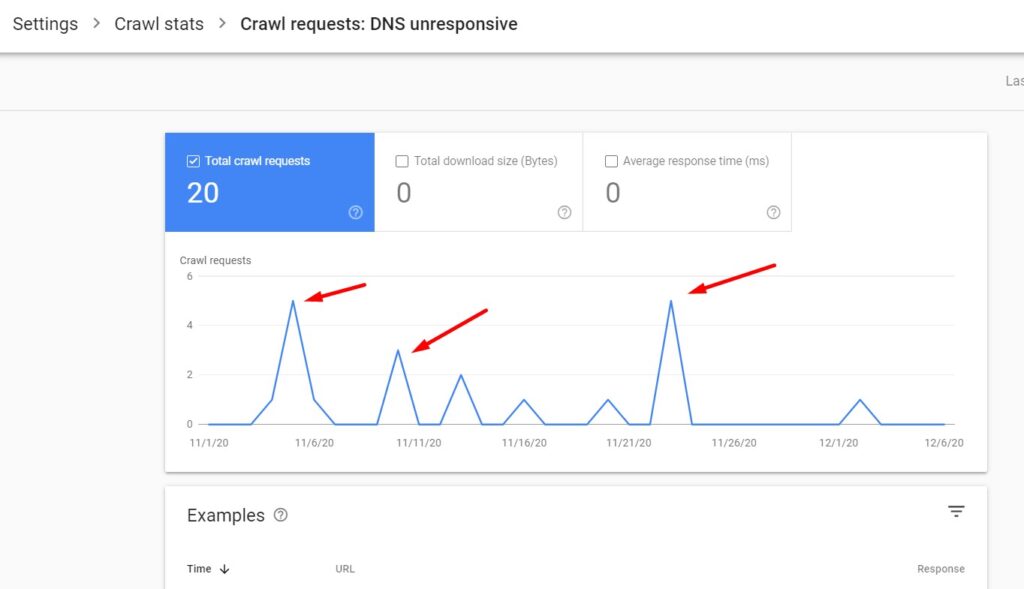
These are the crawl responses you should be watching out for. They make it difficult or impossible for Google to crawl your website. On the screenshot below you can see 2 examples of bad crawl responses:
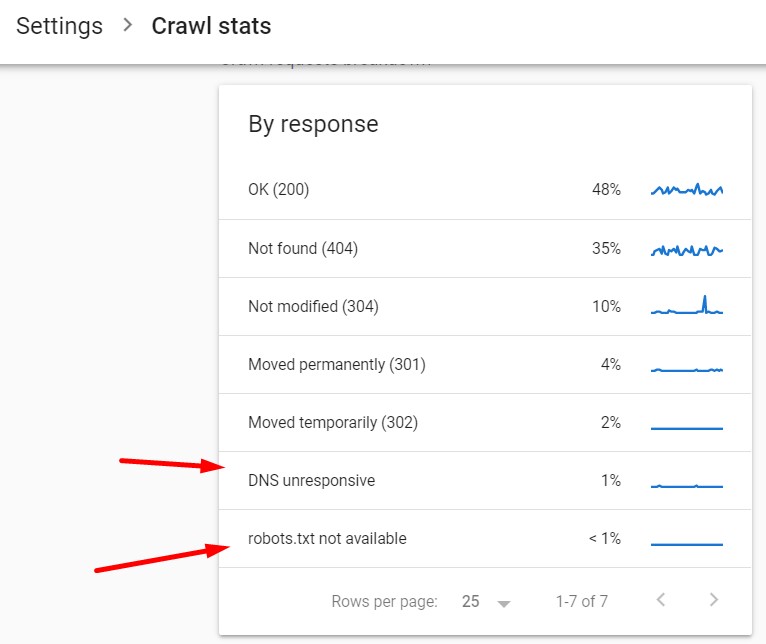
The bad crawl response codes include:
- Robots.txt not available ❗
This one is very important because Google will stop crawling your website entirely until it gets a correct (acceptable) response. Acceptable responses for robots.txt requests are 200 (OK), and 404 (Not found).
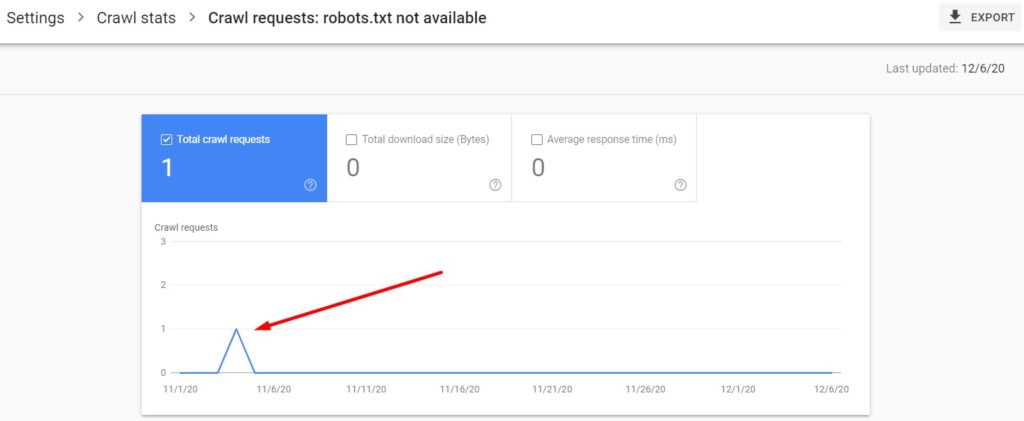
- 401/407 (unauthorized) ❗
The web pages returning 401/407 status codes are the pages that require authorization (like logging in). They should either be blocked from crawling or – if they are not intended to return the unauthorized status – changed into regular web pages returning 200 (OK).
- 5XX (server error) ❗
This error means there are issues with your server availability to Google. In rare cases of really huge websites, server errors may result from Google crawling too much. However, in most cases, Google is pretty good at estimating how much it can crawl without overloading the server.
- 4XX (client error other than 404) ❗
- DNS unresponsive, or any other DNS errors ❗
- Fetch error ❗
- Page could not be reached ❗
☝️ Page could not be reached is an interesting one. It shows the requests that never reached the server due to the issues with page retrieval. Since these requests have not been completed, you will not see them in server logs. But you will see them here in your crawl stats in Google Search Console.
- Page timeout ❗
- Redirect error (redirect loop, empty redirect, or too many redirects) ❗
In most cases, you should investigate the above errors and fix them as quickly as possible because they impact how and if Google is crawling your website.
What to do with the statistics about crawl responses?
Good responses do not require any action from your side. When it comes to possibly good and bad crawler responses, I suggest you do the following:
- Analyze any possibly good responses to make sure this is really what you intend.
- For example, if there are 404 web pages, make sure that these are not valuable web pages that you don’t want to return an error.
- The same goes for the resources blocked in robots.txt. Unless you have a really huge website (with hundreds of thousands or millions of web pages), you probably don’t need to be blocking any resources in robots.txt.
- Take a deep look at all the bad responses and make sure to fix those errors as quickly as possible.
- The most important issues that should be fixed first are:
- Robots.txt not available (this one prevents Google from crawling your website)
- Server errors (which may slow down the crawling of your website)
4. Use the report to analyze the crawled file types
The crawl request breakdown also lets you see the statistics for the crawl requests grouped by the file type. The percentages you see next to each file type correspond to the percentage of responses returned by a given file type.
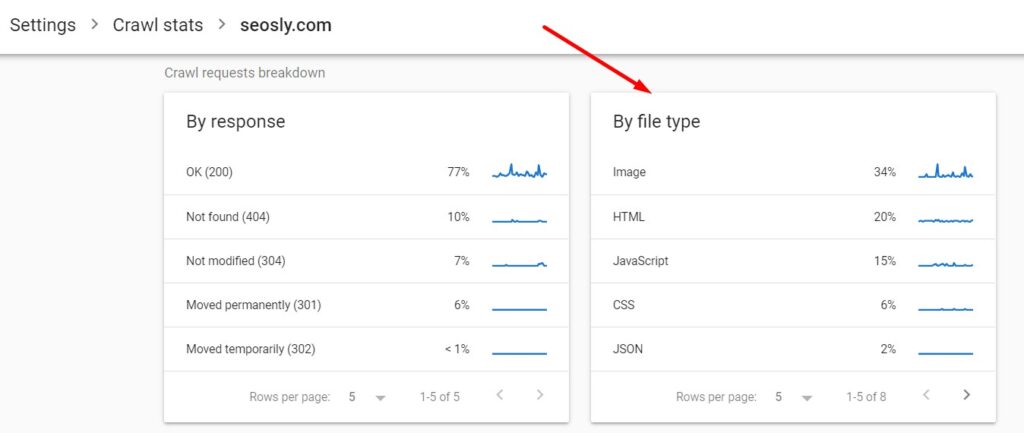
To see the crawling details for each file type, simply click on the file type you want to investigate. Here are the details for the HTML files for my website.
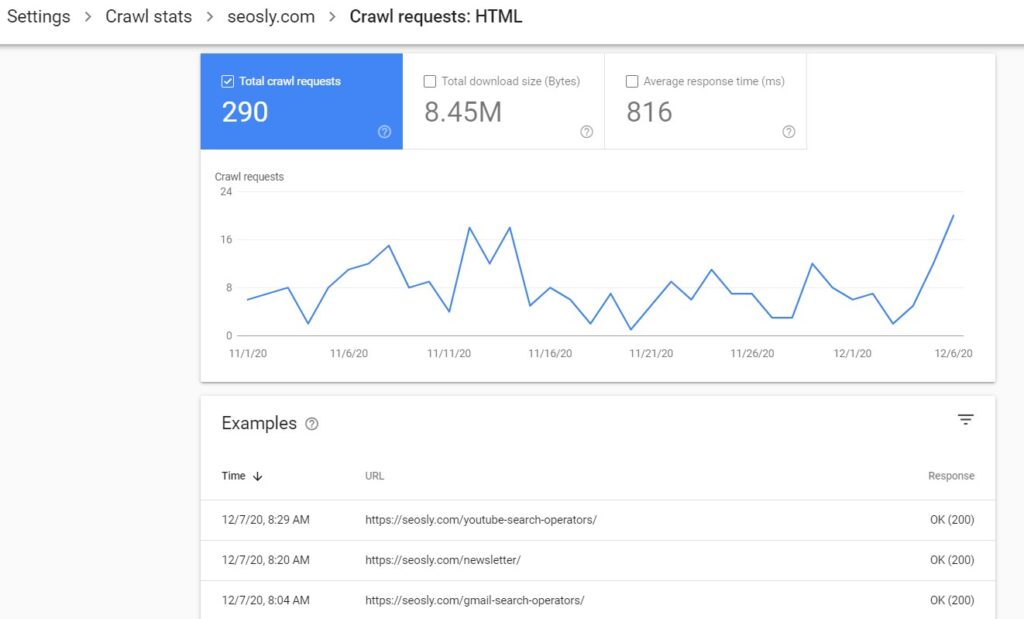
On the top of the page, there is the chart (like the one you see on the main crawl stats page) that shows the total crawl requests, total downloaded size, and average response time for the file type selected. In the example, I am showing you these are HTML files.
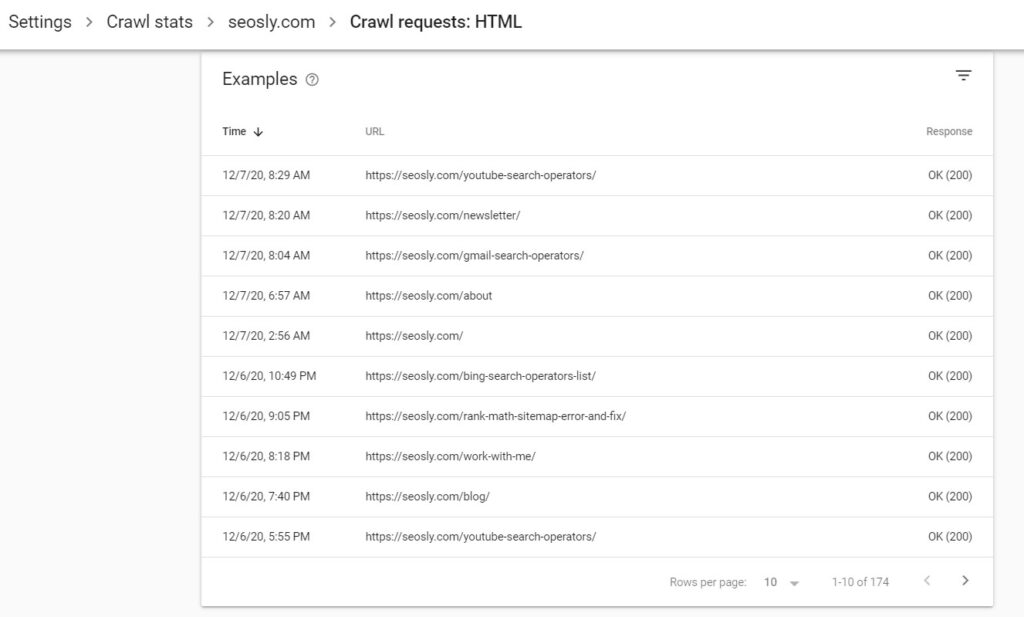
The examples show the time of the request, the URL and the response received.
The types of files Google can recognize and show you in this report include HTML, image files, video, JavaScript, CSS, PDF, XML, JSON, Syndication (RSS or Atom), Audio, KML (or other geographic data).
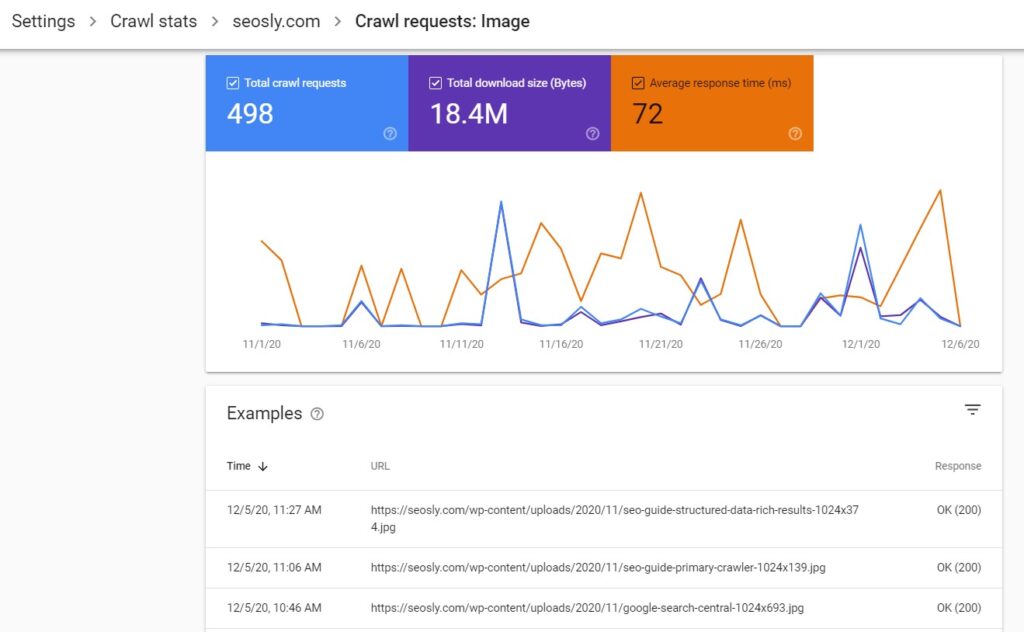
The possible file types to be displayed here also include Other file types (if this is the file other than the ones specified above) and Unknown (when the request has failed and Google cannot determine the file type).
What to do with the statistics about the crawled file types?
Not only is the crawl request breakdown by file type fun to analyze but it can also help you diagnose serious crawling issues on your website, such as server availability issues or slow response rates.
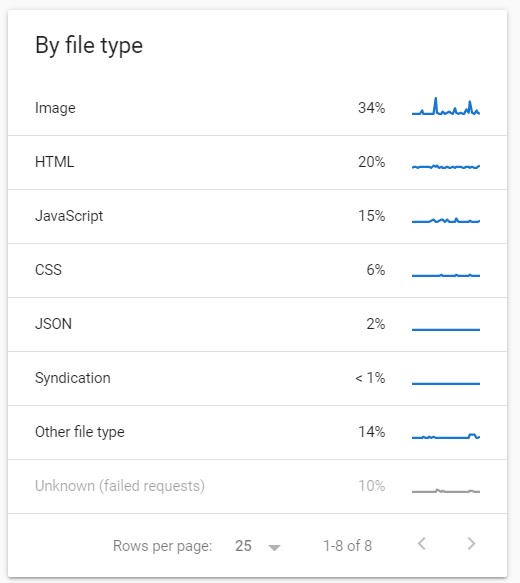
Here are a few tips:
- Check what resource types Google is crawling the most on the website (take a look at the percentage). The questions to ask yourself:
- Are these images? If so, are these important images you want Google to crawl?
- Are these JavaScript files?
- Are there any spikes in the average response time? The spike means that the response time was slower than usual.
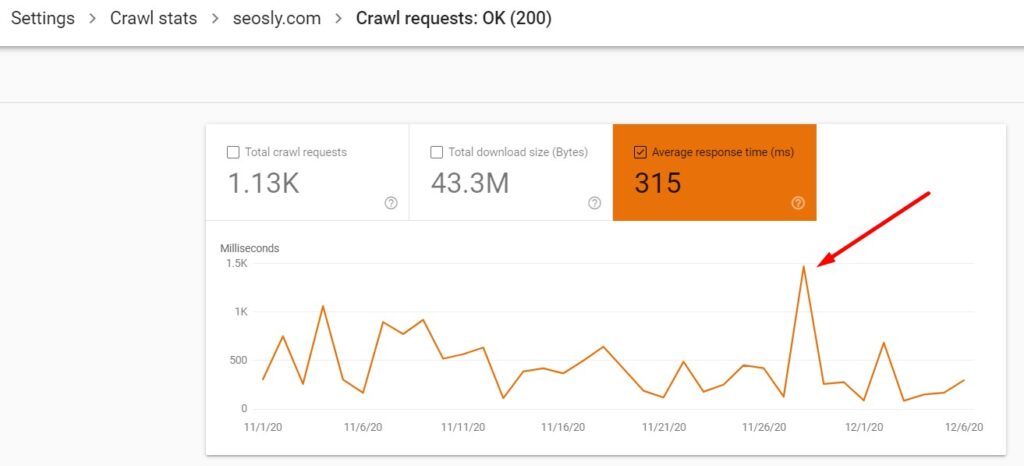
Make sure that you really want Google to crawl all of these resources that it is currently crawling. If not, block them in robots.txt.
- Check the average response rate for different file types. The questions to ask yourself:
- Is it higher (or a lot higher) than the average response for all the requests to your website?
- Are there any spikes over time?
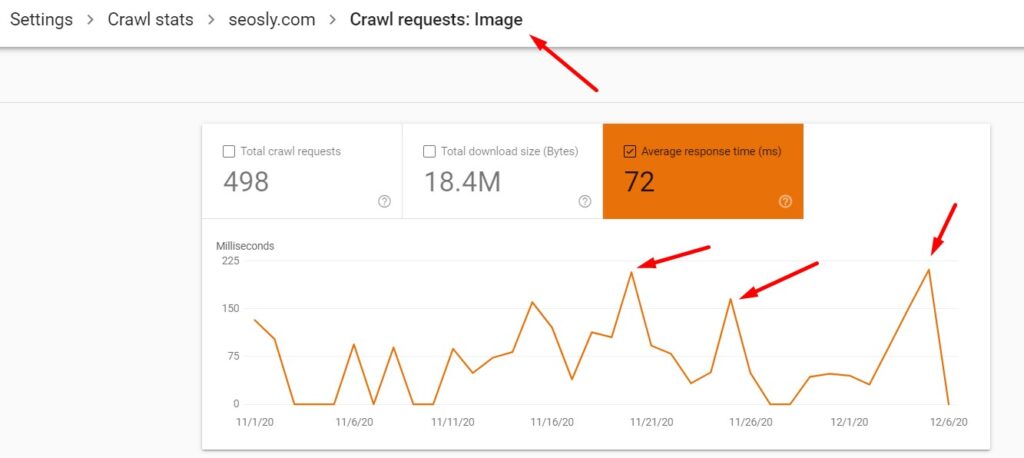
- Check the total download size of different resource types.
- How big or small is it in relation to the total download size for all the requests? Make sure to compare the total download requests with the total downloaded size because the more requests the bigger the total download size.
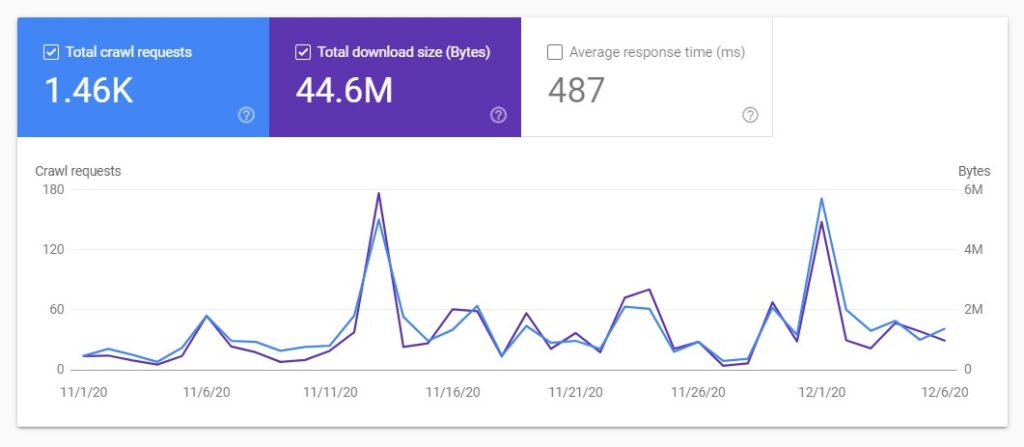
Answering the above questions should give you the clue about what is causing crawling problems on your website.
5. Use the report to learn about the crawl purpose
I like this one a lot! This is simply the breakdown of crawl requests by purpose.
As far as I know, there are two possible purposes:
- Refresh (to recrawl a known web page)
- Discovery (to crawl new web pages
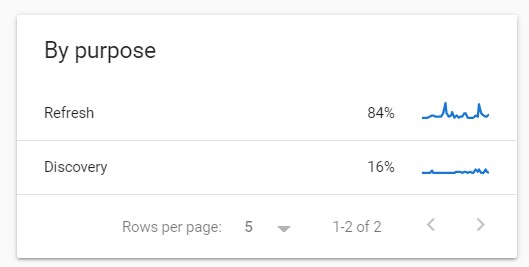
Click on the crawl purpose to learn the details about the refresh and discovery requests.
You will see a similar chart but this time showing total crawl requests, total download size, and average response time for the refresh or discovery crawl requests.
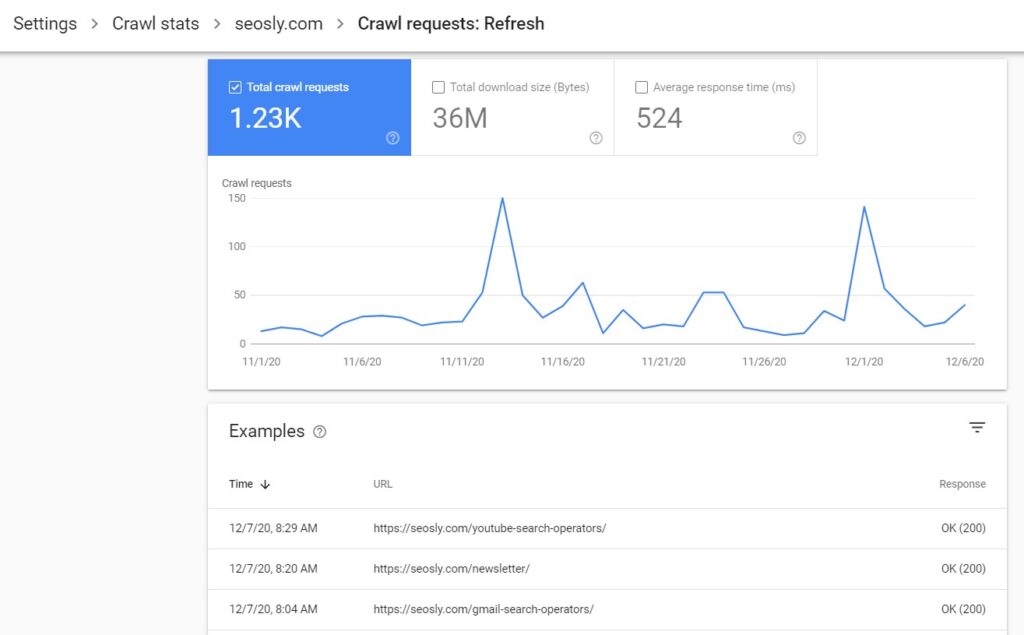
The table with examples will show you the example URLs requested for that purpose, the request time, and the response received.
PRO TIP: Remember that the examples may not include all the requests made. This is just a sample.
What to do with the statistics about the crawl purpose?
Here are a few tips for you on using the crawl purpose stats:
- If you have a news site that is changing all the time and you don’t see enough activity regarding discovery crawling, then make sure to have an up-to-date sitemap (and submit it to GSC). Check my article on how to find the sitemap of a website.
- You should see spikes in discovery crawling after submitting a sitemap or adding a lot of new content.
6. Use the report to analyze Googlebot types
Last but not least comes the report with the statistics about the types of Google user agents that have visited the website over the last 90 days.
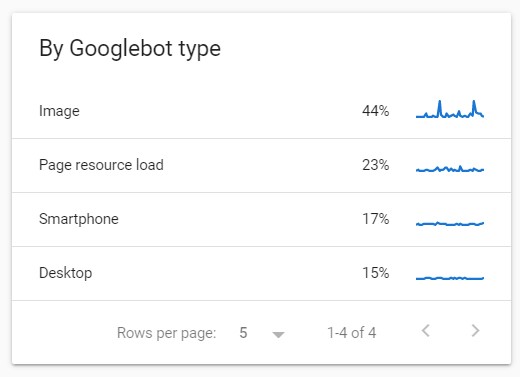
This table lists Googlebot types together with the percentage of the requests made by each user agent. Click on the specific user agent to display the details about its behavior.
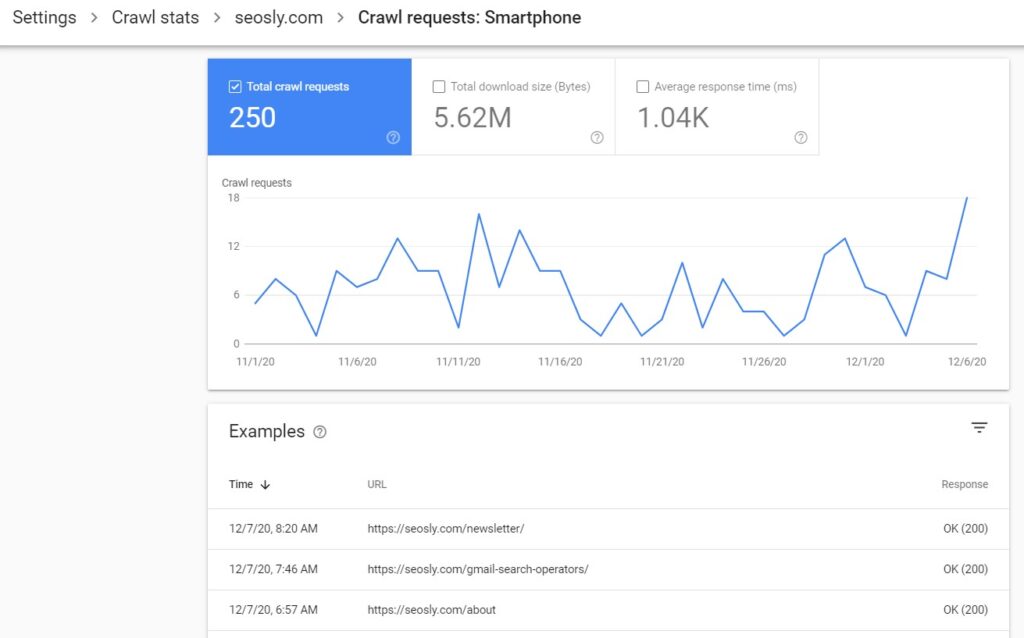
The details include total crawl requests, total download size, average response time, and the table with example resources requested by a specific user-agent.
The table with examples will give you information about the time of the request, the URL requested, and the response received.
Here are Google user agents you can find in the report:
- Googlebot smartphone (reported as Smartphone)
- Googlebot desktop (reported as Desktop)
- Googlebot image (reported as Image)
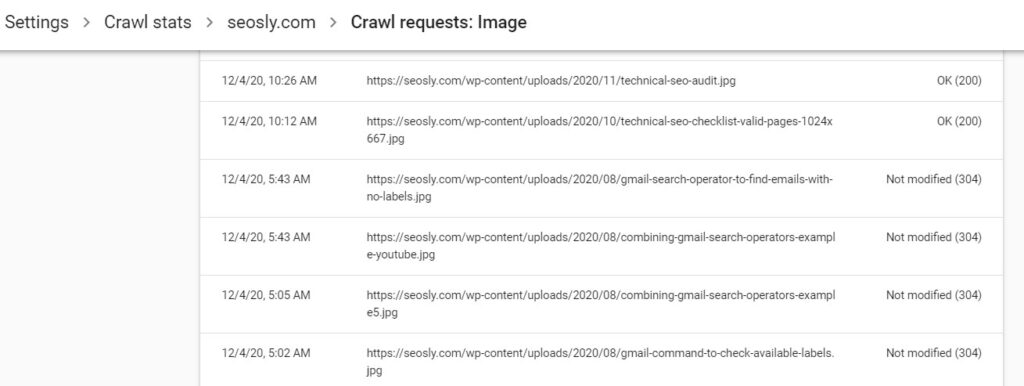
- Googlebot video (reported as Video)
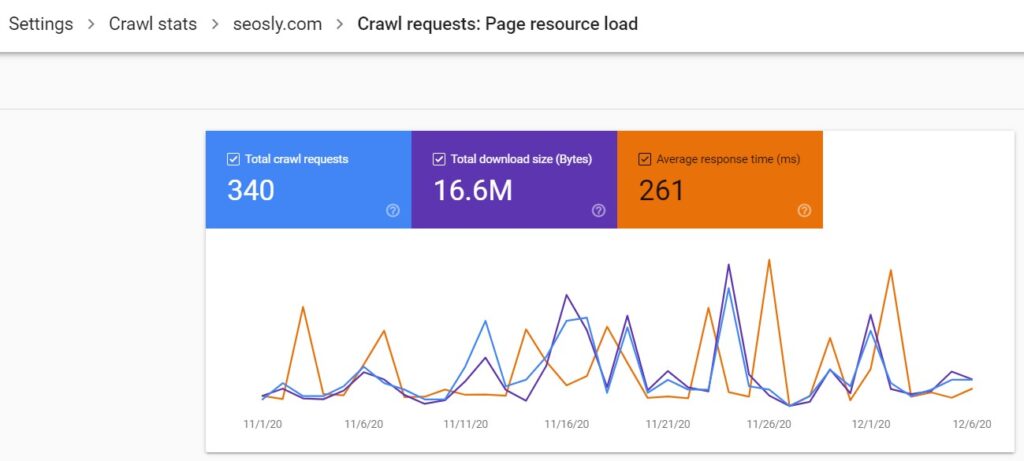
- Page resource load
- AdsBot
- StoreBot
- Other agent type (none of the above)
What to do with the statistics about the Googlebot type?
Here are a few tips on how to use the information about Google user agents crawling your website:
- Your primary crawler (either Googlebot smartphone or Googlebot desktop but most likely Googlebot smartphone) should be the user agent that makes the majority of requests.
- It is important to note that the Page resource load user agent is reported upon a secondary fetch for the resources of a web page. When crawling a web page, Google fetches key resources like CSS or images to render the web page before indexing. The user agent reported as Page resource load makes these requests. If images or videos are loaded as a page resource for rendering purposes, then their user agent is Page resource load (not Google image or Googlebot video).
- The AdsBot crawler crawls websites every two weeks (according to Google documentation).
- A spike in the AdBots crawler activity may occur after new targets for Dynamic Search Ads are created on a website (with the use of page feeds or URL_Equals). }-[p-l[=0o9;[‘., kmp[‘;|}
7. Interpret crawl spikes and drops
Google is quite good at determining and adjusting the crawl rate of your website. However, there are situations where even Google does not get things right and is either crawling too much or too little.
What to do when the crawl rate is too low?
Here are some tips on what to do when your crawl rate is too low (Google is crawling too little):
- If you have a brand-new website, don’t expect lots of crawling activity. This is a common situation with new websites that don’t have many backlinks. In this case, there are two things to do:
- create an XML sitemap and submit it via Google Search Console (and indicate its location in robots.txt)
- keep creating new and high-quality content
- You cannot ask Google to increase the crawl rate for your website (unfortunately). The only situation in which you can do that is if you have explicitly reduced the crawl rate for your website and it remains reduced at the moment you want Google to increase it. Check my guide to crawl budget optimization.
- Check your robots.txt:
- Maybe you or someone from your team added a new rule to the robots.txt file and it is now blocking the parts of your website you don’t want to be blocked from crawling.
- And also make sure that the entire website is not blocked from crawling. It is surprising how often that happens!
- Google won’t be able to crawl pages with broken HTML or unsupported media types. To make sure that Google can parse your web page, use the URL inspection tool.
- Google may crawl your website less frequently if the content on it does not change frequently, or (sorry to say it) if it’s not of the best quality. The best way to assess the quality of a website is by analyzing the quality criteria laid out in Google Quality Evaluator Guidelines.
What to do when the crawl rate is too high?
Believe it or not, Google crawling your website too much can also be a problem, especially if Google is overloading your server with requests.
Here is what you can do to stop Google from overloading your website with requests:
- Do a server log analysis or check the Googlebot type section of the crawl stats report to see what Googlebot type is crawling too much.
- Lower Googlebot crawl rate in the crawl rate settings (it will remain lower for 90 days). Give Google 1-2 days to adjust.
- Note that a spike in crawling is a good thing (unless it is killing your website). It may happen once you add a lot of new content to your website or allow for crawling the section that had previously been blocked from crawling.
8. Compare crawl stats report with your server logs
This will be probably the most fun. Here is what you need to know about crawl stats report and your server logs to be able to correctly interpret both:
- The crawl stats in Google Search Console do not contain all the crawl requests Google made to your website.
- Your server logs, however, will contain all the Googlebot requests.
- Google Search Console crawl stats will obviously only give you the stats about Google user-agents.
- In your server logs, you will see the activity of every user agent that crawled your website. This, of course, includes user agents of other search engines as well. And any other user agents.
- The Google Search Console crawl stats will report on pages that cannot be reached (under Response you will see Page could not be reached). You won’t find this in your serval logs.
- Unless you are working on your own website and have full access to the server and its logs, Google Search Console crawl stats may be your only chance to take a look at how Google is crawling the website. If you work for a bigger client, it may be near impossible to get server logs from their development team. That is why you should know how to use and – if needed – act upon the crawl stats report.
How NOT to use the new crawl stats report: the DON’TS
And finally, here are a few tips on how you should not use the crawl stats report. DO NOT use the new crawl stats report:
- To find broken (404) pages on a website ❌
The report will only show you a sample of URLs that returned 404 when the Googlebot was crawling the website. To detect all 404 pages, crawl a website with a crawler like Screaming Frog or Semrush.
- To check if there are redirects (301, 302, or other) in a website or if they are implemented correctly ❌
Just like above. These are only the redirects that the Googlebot came across and crawled. To see the whole picture, you need to crawl the website yourself.
- To analyze the speed of a website ❌
The report shows you the average response time for the Googlebot. To get a comprehensive look into the speed of the website, you need to check it with speed tools like Google PageSpeed Insights, GTmetrix, or WebPageTest.
- To check or diagnose JavaScript rendering ❌
In the table By file type, you will see the requests for JavaScript files. This has nothing to do with how the Googlebot is rendering JavaScript on the website. To check this, you need to run the Mobile-Friendly Test or render JavaScript with some website crawler like Screaming Frog.
- To check whether the website is mostly visited by desktop or mobile users ❌
What you see in the table By Googlebot type is not reflective of the percentage of smartphone vs desktop users on your website. This information is available in Google Analytics.
- To check if your website has been switched to mobile-first indexing ❌
It does not matter if your website has been switched to mobile-first indexing or not. Both Googlebot smartphone and desktop may be crawling your site. To check your primary crawler, go to Index > Coverage. At the top of the page, you will see the info about the primary crawler for your website.

That’s about it.
🤓 I wanted this guide to be a mini guide of about 1000 words but – as always – it turned out to be 6 times bigger. My hope, therefore, is that you can use it to the benefit of your website and that I have beaten this topic to death.
Check my other Google Search Console articles and guides:
- How To Do An SEO Audit (190+ Steps)
- How To Use Google Search Console For Keyword Research
- How To Perform An SEO Audit Using Google Search Console
- Does Google Search Console Show All Data?
- Can I Use Google Search Console For Keyword Research?
- How To Add And Remove Users In Google Search Console
- How To Add Google Search Console To WordPress
- 80+ Best SEO Chrome Extensions
- 50+ Google SEO Tools
- Google Analytics 4 Basic (SEO) Guide
- Review Of SEOcrawl
- 7 Ways To Use Ahrefs Webmaster Tools
- How To Audit A Site With Ahrefs Site Audit
- Don’t Disavow Backlinks (Unless You Read This)
- Duplicate Without User-Selected Canonical
- Discovered – Currently Not Indexed in Google Search Console
Hi Olga,
Thank you for writing this detailed guide. I have 2 questions:
1. Is there a way to check the download size and response time for a select set of pages?
2. Based on your experience, what is an acceptable avg. response time for a large site with 500k-1M+ pages?
Thanks,